
 Yahoo Finance
 Costco's (COST) Q3 Top Line Lags, Comparable Sales Up 0.3%
Costco Wholesale Corporation COST came up with third-quarter fiscal 2023 results, wherein the top line came below the Zacks Consensus Estimate but improved year over year. Comparable sales also increased, but the rate of growth sharply decelerated on a sequential basis. This is because inflation and a high-interest rate environment discomforted the family budget, compelling consumers to pull back on spending. The company’s comparable e-commerce sales also declined during the quarter.
Q3 Earnings & Sales Picture
Costco posted third-quarter earnings of $2.93 per share, which includes a non-recurring charge of 50 cents a share, primarily for the discontinuation of charter shipping activities. This compared with $3.04 per share reported in the year-ago period, which included a non-recurring charge of 13 cents per share for incremental employee benefits.
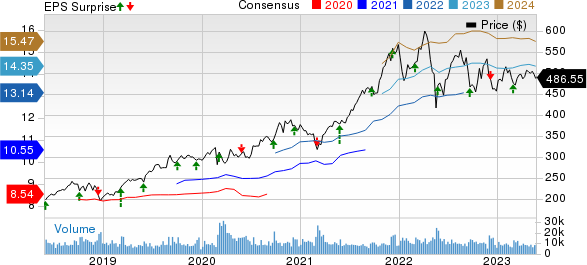
Costco Wholesale Corporation Price, Consensus and EPS Surprise
Costco Wholesale Corporation price-consensus-eps-surprise-chart | Costco Wholesale Corporation Quote
Excluding charges, the company reported adjusted earnings of $3.43 per share compared with $3.17 posted in the year-ago period. The Zacks Consensus Estimate for earnings per share stood at $3.32.
Total revenues, which include net sales and membership fees, came in at $53,648 million, up 2% from the prior-year quarter. However, the metric missed the Zacks Consensus Estimate of $54,569.9 million.
In the reported quarter, the company’s comparable e-commerce sales fell 10% year over year. Excluding the impact of gasoline prices and foreign exchange, the same declined 9% year over year.
Delving Deeper
Costco’s net sales grew 1.9% year over year to $52,604 million, while membership fees increased 6.1% to $1,044 million in the reported quarter. Costco’s growth strategies, improved price management and decent membership trends have been contributing to its performance.
Comparable sales rose a mere 0.3% from the prior-year quarter. This showed a sharp deceleration from the increases of 5.2% and 6.6% in the second and first quarters, respectively.
Comparable sales for the quarter under discussion reflect a decline of 0.1% and 1% in the United States and Canada, respectively, but an increase of 4.1% in Other International locations, respectively.
We note that traffic or shopping frequency rose 4.8% globally and 3.5% in the United States. The average transaction or ticket was down 4.2% globally and 3.5% in the United States.
Excluding the impact of foreign currency fluctuations and gasoline prices, the company witnessed comparable sales growth of 3.5% in the quarter. The United States, Canada and Other International locations registered comparable sales growth of 1.8%, 7.4% and 8.4%, respectively.
The operating income in the quarter decreased 6.3% year over year to $1,679 million. Meanwhile, the operating margin (as a percentage of total revenues) contracted 30 basis points to 3.1%.
Store Update
Costco currently operates 853 warehouses. These include 587 in the United States and Puerto Rico, 107 in Canada, 40 in Mexico, 32 in Japan, 29 in the United Kingdom, 18 in Korea, 14 in Taiwan, 14 in Australia, four in Spain, three in China, two in France and one each in Iceland, New Zealand and Sweden.
In the third quarter, Costco opened four net new warehouses. The company plans to open nine warehouses with no relocations in the fourth quarter. In fiscal 2023, the company plans to open 26 warehouses, including three relocations. These will lead to net 23 new warehouses, which consist of 13 in the United States and 10 in Other International.
Financial Aspects
Costco ended the reported quarter with cash and cash equivalents of $12,493 million and long-term debt (excluding the current portion) of $6,497 million. Shareholders’ equity was $23,573 million.
Management incurred capital expenditures of roughly $819 million in the third quarter. The company anticipates capital expenditures for fiscal 2023 to be approximately $4 billion.
Shares of this Zacks Rank #3 (Hold) company have risen 6.6% so far in the year against the industry’s decline of 1.3%.
3 Picks You Can’t Miss Out On
Here we have highlighted three better-ranked stocks, namely Kroger KR, The TJX Companies TJX and General Mills GIS.
Kroger, which operates as a supermarket operator, currently carries a Zacks Rank #2 (Buy). The expected EPS growth rate for three to five years is 6%. You can see the complete list of today’s Zacks #1 Rank (Strong Buy) stocks here.
The Zacks Consensus Estimate for Kroger’s current financial-year revenues and EPS suggests growth of 2.5% and 6.6%, respectively, from the year-ago reported figure. Kroger has a trailing four-quarter earnings surprise of 9.8%, on average.
TJX Companies, which operates as an off-price apparel and home fashion retailer, carries a Zacks Rank #2. The expected EPS growth rate for three to five years is 10.5%.
The Zacks Consensus Estimate for TJX Companies’ current financial-year sales and earnings suggests growth of 6.4% and 14.5% from the year-ago period. TJX has a trailing four-quarter earnings surprise of 4.4%, on average.
General Mills, which manufactures and markets branded consumer foods, currently carries a Zacks Rank #2. The expected EPS growth rate for three to five years is 7.5%.
The Zacks Consensus Estimate for General Mills’ current financial-year sales and earnings suggests growth of 6.3% and 7.4% from the year-ago period. GIS has a trailing four-quarter earnings surprise of 8.1%, on average.
Want the latest recommendations from Zacks Investment Research? Today, you can download 7 Best Stocks for the Next 30 Days. Click to get this free report
The TJX Companies, Inc. (TJX) : Free Stock Analysis Report
General Mills, Inc. (GIS) : Free Stock Analysis Report
The Kroger Co. (KR) : Free Stock Analysis Report
Costco Wholesale Corporation (COST) : Free Stock Analysis Report
