
 Yahoo Finance
 Crude Oil, Gold and SPX 500 Await Direction Cues in Established Ranges
DailyFX.com -
Talking Points:
US Dollar Fails to Pierce Monthly Range Top Again
S&P 500 Rally Fizzles After Hitting New Record High
Gold, Crude Oil Prices Locked in Familiar Territory
Can’t access the Dow Jones FXCM US Dollar Index? Try the USD basket on Mirror Trader. **
US DOLLAR TECHNICAL ANALYSIS – Prices continue to tread water having topped as expected after putting in a bearish Evening Star candlestick pattern. A daily close below the 14.6% Fibonacci retracementat 11740 exposes the 23.6% level at 11653. Alternatively, a turn above the 11854-76 zone (14.6% Fib expansion, March 2009 high) clears the way for a test of the 23.6% expansion at 11963.
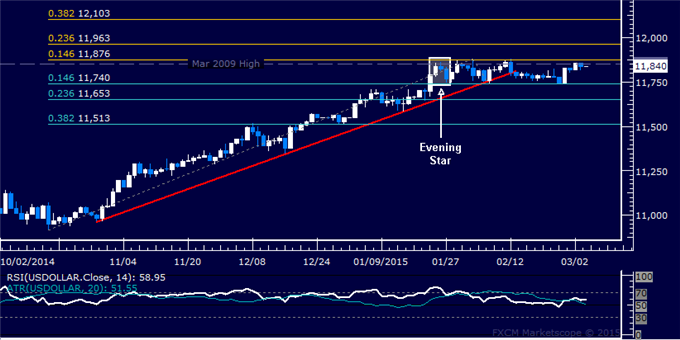
Daily Chart - Created Using FXCM Marketscope
** The Dow Jones FXCM US Dollar Index and the Mirror Trader USD basket are not the same product.
S&P 500 TECHNICAL ANALYSIS – Prices paused to digest gains after advancing to yet another record high. A daily close above the 14.6% Fibonacci expansion 2117.80 exposes the 23.6% level at 2130.40. Near-term range support is at 2101.40, with a break below that targeting the 23.6% Fib retracement at 2086.40.

Daily Chart - Created Using FXCM Marketscope
GOLD TECHNICAL ANALYSIS – Prices continue to consolidate after descending to a two-month low below the $1200/oz figure. A break below the 23.6% Fibonacci expansion at 1194.94 exposes the 38.2% level at 1177.51. Alternatively, a rebound above the 1216.30-19.30 area marked by trend line support-turned-resistance and the 23.6% Fib retracement targets the 38.2% threshold at 1233.73.
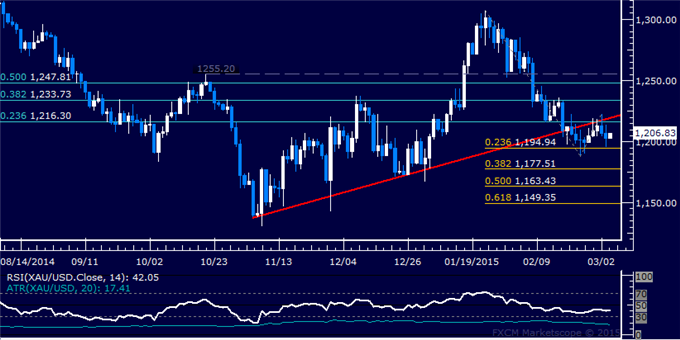
Daily Chart - Created Using FXCM Marketscope
CRUDE OIL TECHNICAL ANALYSIS – Prices launched a recovery as expected, with buyers now consolidating below February’s swing high. From here, a break below channel support at 60.16 exposes resistance-turned-support at 58.17. Alternatively, a close above the February 17 high at 62.98 exposes the 38.2% Fibonacci expansion at 66.69.
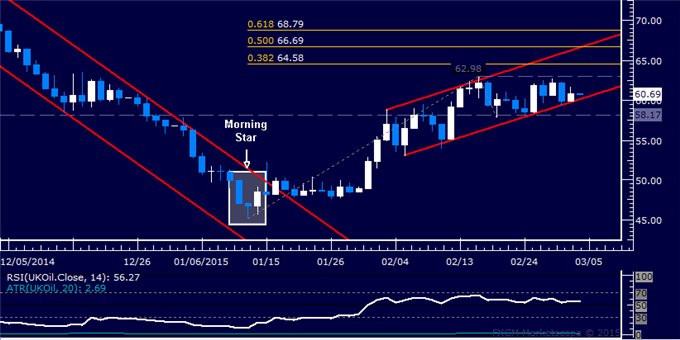
Daily Chart - Created Using FXCM Marketscope
--- Written by Ilya Spivak, Currency Strategist for DailyFX.com
To receive Ilya's analysis directly via email, please SIGN UP HERE
Contact and follow Ilya on Twitter: @IlyaSpivak
DailyFX provides forex news and technical analysis on the trends that influence the global currency markets.
Learn forex trading with a free practice account and trading charts from FXCM.
