
 Yahoo Finance
 Crude Oil Price Update – In Position to Form Bearish Closing Price Reversal Top
April West Texas Intermediate crude oil futures are under pressure on Tuesday, weakened by a stronger U.S. Dollar, profit-taking and a drop in demand for higher-risk assets.
Daily Technical Analysis
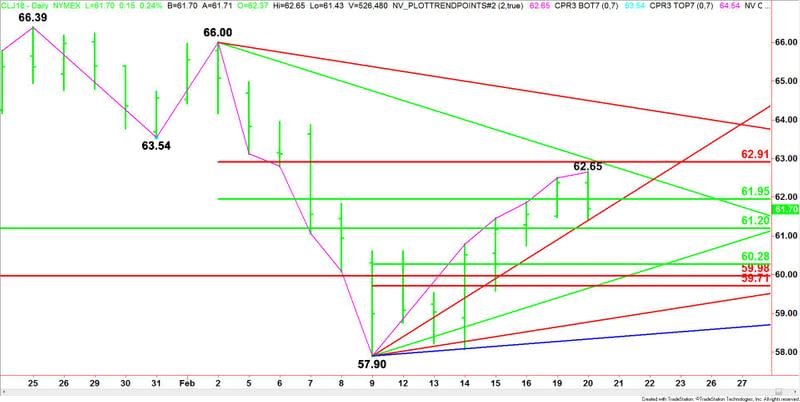
The main trend is down according to the daily swing chart. Today is the seventh day up from the recent main bottom, putting the market in the window of time for a potentially bearish closing price reversal top.
Currently, the market is trading lower after posting a higher-high. This is the first sign that a reversal top is forming. If it does form then look for the start of a 2 to 3 day break or a 50% to 61.8% retracement of the last rally.
The intermediate range is $66.00 to $57.90. Its retracement zone is $61.95 to $62.91. Today’s high at $62.65 fell inside this zone.
The main retracement zone is $61.20 to $59.98.
The short-term range is $57.90 to $62.65. Its retracement zone at $60.28 to $59.71 is the primary downside target. Inside this zone is the main Fibonacci level at $59.98.
Daily Technical Forecast
Based on the early price action, the direction of the crude oil market the rest of the session is likely to be determined by trader reaction to the steep uptrending Gann angle at $61.40.
A sustained move over $61.40 will indicate the presence of buyers. This could drive the market back to a 50% level at $61.95. Overcoming the 50% level will indicate the buying is getting stronger with the first target a downtrending Gann angle at $63.00, followed by $62.91.
A sustained move under $61.40 will signal the presence of sellers. This could trigger a quick break into the 50% level at $61.20.
This 50% level is a potential trigger point for an acceleration to the downside with potential targets at $60.28, $59.98, $59.71 and $59.65.
Watch the price action and read the order flow at $61.40 all session. Trader reaction to this angle will tell us if the buyers or sellers are in control.
This article was originally posted on FX Empire
More From FXEMPIRE:
Gold Price Futures (GC) Technical Analysis – Heading into Retracement Zone at $1336.70 to $1330.20
E-mini S&P 500 Index (ES) Futures Technical Analysis – February 20, 2018 Forecast
EUR/USD Mid-Session Technical Analysis for February 20, 2018
E-mini Dow Jones Industrial Average (YM) Futures Analysis – February 20, 2018 Forecast
