
 Yahoo Finance
 Crude Oil Price Update – Strengthens Over $68.45, Weakens Under $67.99
U.S. West Texas Intermediate crude oil futures are trading slightly better early Friday, but remain inside Thursday’s wide range. This indicates investor indecision and impending volatility. Despite yesterday’s strong performance, the market remains in a position to close lower for the week.
At 0607 GMT, September WTI crude oil is trading $68.35, up $0.11 or +0.15%.
It’s hard to explain Thursday’s rally, but I suspect it had something to do with the sudden plunge in the U.S. Dollar. This may have encouraged shorts to cover positions since crude oil is a dollar-denominated commodity. Fundamentally, oversupply remains a major concern.
Daily Swing Chart Technical Analysis
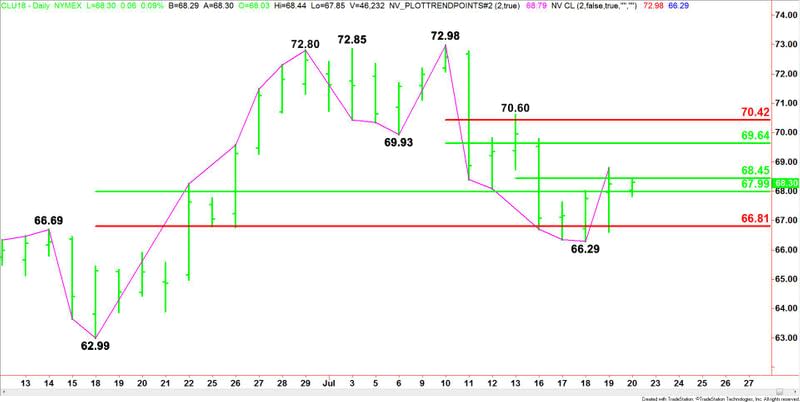
The main trend is down according to the daily swing chart. However, momentum shifted to the upside with the formation of a closing price reversal bottom on Wednesday and yesterday’s subsequent confirmation of the chart pattern.
Yesterday’s price action made $66.29 a new main bottom. A trade through this level will signal a resumption of the downtrend. The main trend will change to up on a move through $72.98.
The minor trend is also down. A trade through $70.60 will change the minor trend to up. This will also confirm the shift in momentum.
The main range is $62.99 to $72.98. Its retracement zone at $67.99 to $66.81 is controlling the longer-term price action. Closing above this zone makes it support.
The short-term range is $70.60 to $66.29. Its 50% level or pivot at $68.45 is acting like resistance today.
The intermediate range is $72.98 to $66.29. If the short-covering rally continues then its retracement zone at $69.64 to $70.42 will become the primary upside target.
Daily Swing Chart Technical Forecast
Based on the early price action, the direction of the September WTI crude oil market will likely be determined by trader reaction to the 50% levels at $68.45 and $67.99.
A sustained move over $68.45 will indicate the presence of buyers. If this move gains traction, we could see a spike into $69.64 to $70.42, followed by $70.60. The latter is the trigger point for an acceleration to the upside with $72.98 the next target.
A sustained move under $67.99 will signal the presence of sellers. This could trigger a spike to the downside into $66.81, followed by $66.29.
The daily chart is wide open to the downside under $66.29 with $62.99 the next major target.
This article was originally posted on FX Empire
