
 Yahoo Finance
 CWC Energy Services Corp.'s (CVE:CWC) Stock is Soaring But Financials Seem Inconsistent: Will The Uptrend Continue?
CWC Energy Services' (CVE:CWC) stock is up by a considerable 47% over the past month. However, we decided to pay attention to the company's fundamentals which don't appear to give a clear sign about the company's financial health. In this article, we decided to focus on CWC Energy Services' ROE.
Return on Equity or ROE is a test of how effectively a company is growing its value and managing investors’ money. Simply put, it is used to assess the profitability of a company in relation to its equity capital.
See our latest analysis for CWC Energy Services
How To Calculate Return On Equity?
ROE can be calculated by using the formula:
Return on Equity = Net Profit (from continuing operations) ÷ Shareholders' Equity
So, based on the above formula, the ROE for CWC Energy Services is:
4.6% = CA$7.6m ÷ CA$163m (Based on the trailing twelve months to March 2022).
The 'return' is the income the business earned over the last year. That means that for every CA$1 worth of shareholders' equity, the company generated CA$0.05 in profit.
What Is The Relationship Between ROE And Earnings Growth?
Thus far, we have learned that ROE measures how efficiently a company is generating its profits. We now need to evaluate how much profit the company reinvests or "retains" for future growth which then gives us an idea about the growth potential of the company. Generally speaking, other things being equal, firms with a high return on equity and profit retention, have a higher growth rate than firms that don’t share these attributes.
A Side By Side comparison of CWC Energy Services' Earnings Growth And 4.6% ROE
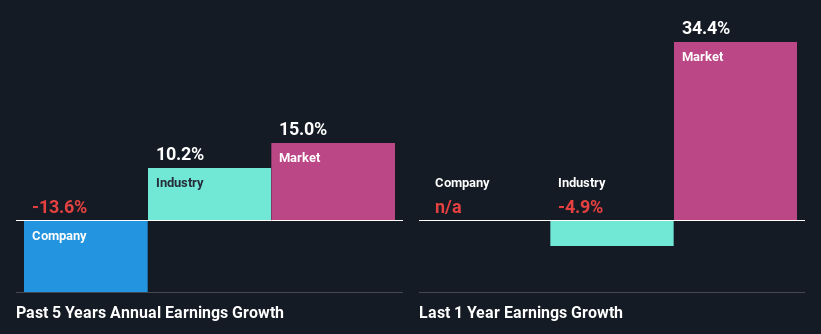
On the face of it, CWC Energy Services' ROE is not much to talk about. We then compared the company's ROE to the broader industry and were disappointed to see that the ROE is lower than the industry average of 14%. Therefore, it might not be wrong to say that the five year net income decline of 14% seen by CWC Energy Services was probably the result of it having a lower ROE. We reckon that there could also be other factors at play here. For example, it is possible that the business has allocated capital poorly or that the company has a very high payout ratio.
That being said, we compared CWC Energy Services' performance with the industry and were concerned when we found that while the company has shrunk its earnings, the industry has grown its earnings at a rate of 10% in the same period.
Earnings growth is a huge factor in stock valuation. What investors need to determine next is if the expected earnings growth, or the lack of it, is already built into the share price. This then helps them determine if the stock is placed for a bright or bleak future. One good indicator of expected earnings growth is the P/E ratio which determines the price the market is willing to pay for a stock based on its earnings prospects. So, you may want to check if CWC Energy Services is trading on a high P/E or a low P/E, relative to its industry.
Is CWC Energy Services Using Its Retained Earnings Effectively?
Because CWC Energy Services doesn't pay any dividends, we infer that it is retaining all of its profits, which is rather perplexing when you consider the fact that there is no earnings growth to show for it. It looks like there might be some other reasons to explain the lack in that respect. For example, the business could be in decline.
Conclusion
In total, we're a bit ambivalent about CWC Energy Services' performance. While the company does have a high rate of profit retention, its low rate of return is probably hampering its earnings growth. Wrapping up, we would proceed with caution with this company and one way of doing that would be to look at the risk profile of the business. To know the 3 risks we have identified for CWC Energy Services visit our risks dashboard for free.
Have feedback on this article? Concerned about the content? Get in touch with us directly. Alternatively, email editorial-team (at) simplywallst.com.
This article by Simply Wall St is general in nature. We provide commentary based on historical data and analyst forecasts only using an unbiased methodology and our articles are not intended to be financial advice. It does not constitute a recommendation to buy or sell any stock, and does not take account of your objectives, or your financial situation. We aim to bring you long-term focused analysis driven by fundamental data. Note that our analysis may not factor in the latest price-sensitive company announcements or qualitative material. Simply Wall St has no position in any stocks mentioned.
