
 Yahoo Finance
 Declining Stock and Decent Financials: Is The Market Wrong About Mercury NZ Limited (NZSE:MCY)?
With its stock down 7.2% over the past three months, it is easy to disregard Mercury NZ (NZSE:MCY). But if you pay close attention, you might find that its key financial indicators look quite decent, which could mean that the stock could potentially rise in the long-term given how markets usually reward more resilient long-term fundamentals. Specifically, we decided to study Mercury NZ's ROE in this article.
ROE or return on equity is a useful tool to assess how effectively a company can generate returns on the investment it received from its shareholders. In short, ROE shows the profit each dollar generates with respect to its shareholder investments.
View our latest analysis for Mercury NZ
How To Calculate Return On Equity?
The formula for return on equity is:
Return on Equity = Net Profit (from continuing operations) ÷ Shareholders' Equity
So, based on the above formula, the ROE for Mercury NZ is:
9.5% = NZ$438m ÷ NZ$4.6b (Based on the trailing twelve months to December 2021).
The 'return' is the amount earned after tax over the last twelve months. That means that for every NZ$1 worth of shareholders' equity, the company generated NZ$0.10 in profit.
Why Is ROE Important For Earnings Growth?
Thus far, we have learned that ROE measures how efficiently a company is generating its profits. Based on how much of its profits the company chooses to reinvest or "retain", we are then able to evaluate a company's future ability to generate profits. Assuming everything else remains unchanged, the higher the ROE and profit retention, the higher the growth rate of a company compared to companies that don't necessarily bear these characteristics.
A Side By Side comparison of Mercury NZ's Earnings Growth And 9.5% ROE
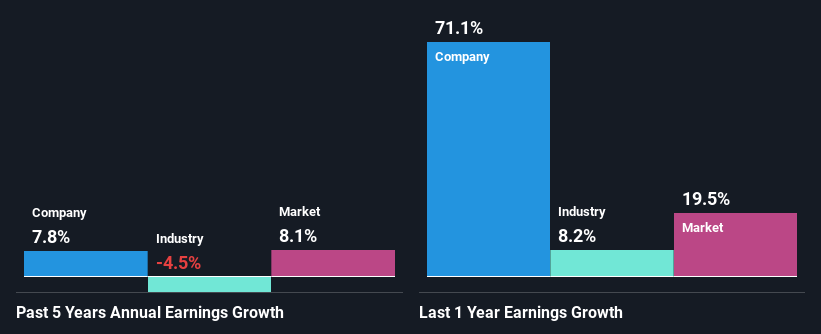
At first glance, Mercury NZ's ROE doesn't look very promising. However, its ROE is similar to the industry average of 8.2%, so we won't completely dismiss the company. Having said that, Mercury NZ has shown a modest net income growth of 7.8% over the past five years. Considering the moderately low ROE, it is quite possible that there might be some other aspects that are positively influencing the company's earnings growth. For instance, the company has a low payout ratio or is being managed efficiently.
When you consider the fact that the industry earnings have shrunk at a rate of 4.5% in the same period, the company's net income growth is pretty remarkable.
Earnings growth is a huge factor in stock valuation. It’s important for an investor to know whether the market has priced in the company's expected earnings growth (or decline). This then helps them determine if the stock is placed for a bright or bleak future. Is MCY fairly valued? This infographic on the company's intrinsic value has everything you need to know.
Is Mercury NZ Using Its Retained Earnings Effectively?
Mercury NZ has a significant three-year median payout ratio of 83%, meaning that it is left with only 17% to reinvest into its business. This implies that the company has been able to achieve decent earnings growth despite returning most of its profits to shareholders.
Additionally, Mercury NZ has paid dividends over a period of nine years which means that the company is pretty serious about sharing its profits with shareholders. Looking at the current analyst consensus data, we can see that the company's future payout ratio is expected to rise to 121% over the next three years. Consequently, the higher expected payout ratio explains the decline in the company's expected ROE (to 5.1%) over the same period.
Summary
In total, it does look like Mercury NZ has some positive aspects to its business. That is, quite an impressive growth in earnings. However, the low profit retention means that the company's earnings growth could have been higher, had it been reinvesting a higher portion of its profits. Having said that, on studying current analyst estimates, we were concerned to see that while the company has grown its earnings in the past, analysts expect its earnings to shrink in the future. To know more about the company's future earnings growth forecasts take a look at this free report on analyst forecasts for the company to find out more.
Have feedback on this article? Concerned about the content? Get in touch with us directly. Alternatively, email editorial-team (at) simplywallst.com.
This article by Simply Wall St is general in nature. We provide commentary based on historical data and analyst forecasts only using an unbiased methodology and our articles are not intended to be financial advice. It does not constitute a recommendation to buy or sell any stock, and does not take account of your objectives, or your financial situation. We aim to bring you long-term focused analysis driven by fundamental data. Note that our analysis may not factor in the latest price-sensitive company announcements or qualitative material. Simply Wall St has no position in any stocks mentioned.
