
 Yahoo Finance
 Despite Its High P/E Ratio, Is CalAmp Corp (NASDAQ:CAMP) Still Undervalued?

This article is for investors who would like to improve their understanding of price to earnings ratios (P/E ratios). To keep it practical, we’ll show how CalAmp Corp’s (NASDAQ:CAMP) P/E ratio could help you assess the value on offer. CalAmp has a P/E ratio of 42.92, based on the last twelve months. That corresponds to an earnings yield of approximately 2.3%.
Check out our latest analysis for CalAmp
How Do I Calculate A Price To Earnings Ratio?
The formula for P/E is:
Price to Earnings Ratio = Price per Share ÷ Earnings per Share (EPS)
Or for CalAmp:
P/E of 42.92 = $17.89 ÷ $0.42 (Based on the year to August 2018.)
Is A High Price-to-Earnings Ratio Good?
A higher P/E ratio implies that investors pay a higher price for the earning power of the business. That isn’t a good or a bad thing on its own, but a high P/E means that buyers have a higher opinion of the business’s prospects, relative to stocks with a lower P/E.
How Growth Rates Impact P/E Ratios
P/E ratios primarily reflect market expectations around earnings growth rates. That’s because companies that grow earnings per share quickly will rapidly increase the ‘E’ in the equation. That means even if the current P/E is high, it will reduce over time if the share price stays flat. So while a stock may look expensive based on past earnings, it could be cheap based on future earnings.
It’s nice to see that CalAmp grew EPS by a stonking 286% in the last year. And earnings per share have improved by 6.8% annually, over the last three years. I’d therefore be a little surprised if its P/E ratio was not relatively high. In contrast, EPS has decreased by 23%, annually, over 5 years.
How Does CalAmp’s P/E Ratio Compare To Its Peers?
We can get an indication of market expectations by looking at the P/E ratio. You can see in the image below that the average P/E (30.9) for companies in the communications industry is lower than CalAmp’s P/E.
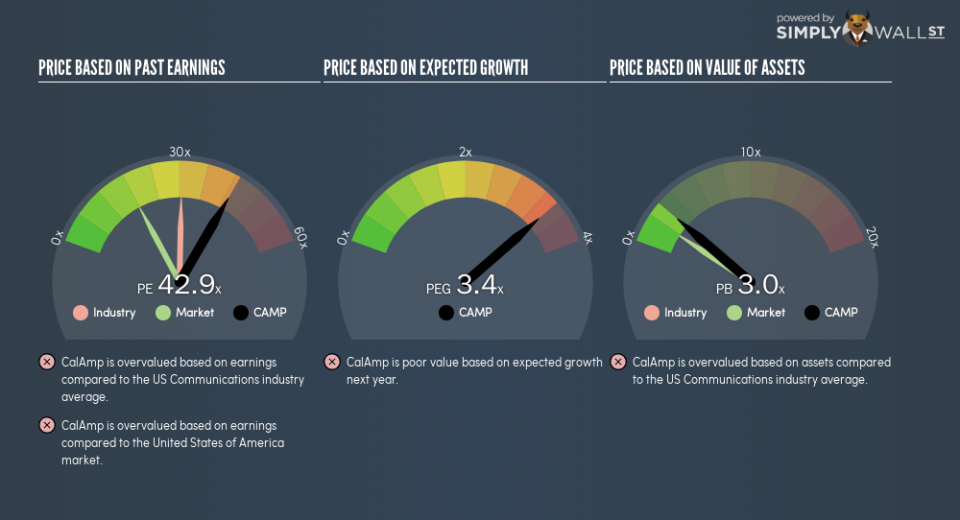
Its relatively high P/E ratio indicates that CalAmp shareholders think it will perform better than other companies in its industry classification. The market is optimistic about the future, but that doesn’t guarantee future growth. So further research is always essential. I often monitor director buying and selling.
Remember: P/E Ratios Don’t Consider The Balance Sheet
Don’t forget that the P/E ratio considers market capitalization. In other words, it does not consider any debt or cash that the company may have on the balance sheet. In theory, a company can lower its future P/E ratio by using cash or debt to invest in growth.
Spending on growth might be good or bad a few years later, but the point is that the P/E ratio does not account for the option (or lack thereof).
Is Debt Impacting CalAmp’s P/E?
The extra options and safety that comes with CalAmp’s US$36m net cash position means that it deserves a higher P/E than it would if it had a lot of net debt.
The Verdict On CalAmp’s P/E Ratio
CalAmp’s P/E is 42.9 which is above average (18) in the US market. With cash in the bank the company has plenty of growth options — and it is already on the right track. Therefore it seems reasonable that the market would have relatively high expectations of the company
Investors should be looking to buy stocks that the market is wrong about. People often underestimate remarkable growth — so investors can make money when fast growth is not fully appreciated. So this free report on the analyst consensus forecasts could help you make a master move on this stock.
Of course, you might find a fantastic investment by looking at a few good candidates. So take a peek at this free list of companies with modest (or no) debt, trading on a P/E below 20.
To help readers see past the short term volatility of the financial market, we aim to bring you a long-term focused research analysis purely driven by fundamental data. Note that our analysis does not factor in the latest price-sensitive company announcements.
The author is an independent contributor and at the time of publication had no position in the stocks mentioned. For errors that warrant correction please contact the editor at editorial-team@simplywallst.com.
