
 Yahoo Finance
 Did Stampscom Inc (NASDAQ:STMP) Create Value For Shareholders?

This article is intended for those of you who are at the beginning of your investing journey and want to begin learning the link between Stampscom Inc (NASDAQ:STMP)’s return fundamentals and stock market performance.
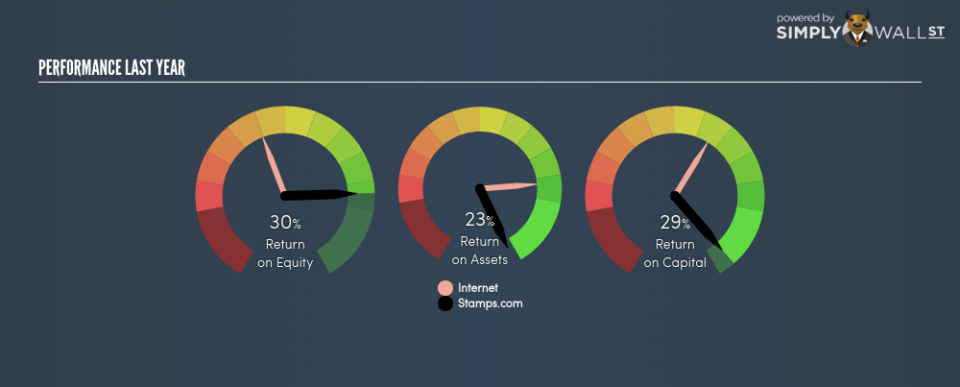
Stampscom Inc (NASDAQ:STMP) delivered an ROE of 30.09% over the past 12 months, which is an impressive feat relative to its industry average of 12.67% during the same period. While the impressive ratio tells us that STMP has made significant profits from little equity capital, ROE doesn’t tell us if STMP has borrowed debt to make this happen. Today, we’ll take a closer look at some factors like financial leverage to see how sustainable STMP’s ROE is. See our latest analysis for Stamps.com
Peeling the layers of ROE – trisecting a company’s profitability
Return on Equity (ROE) is a measure of Stamps.com’s profit relative to its shareholders’ equity. An ROE of 30.09% implies $0.30 returned on every $1 invested. In most cases, a higher ROE is preferred; however, there are many other factors we must consider prior to making any investment decisions.
Return on Equity = Net Profit ÷ Shareholders Equity
ROE is measured against cost of equity in order to determine the efficiency of Stamps.com’s equity capital deployed. Its cost of equity is 12.09%. Given a positive discrepancy of 18.00% between return and cost, this indicates that Stamps.com pays less for its capital than what it generates in return, which is a sign of capital efficiency. ROE can be dissected into three distinct ratios: net profit margin, asset turnover, and financial leverage. This is called the Dupont Formula:
Dupont Formula
ROE = profit margin × asset turnover × financial leverage
ROE = (annual net profit ÷ sales) × (sales ÷ assets) × (assets ÷ shareholders’ equity)
ROE = annual net profit ÷ shareholders’ equity
Basically, profit margin measures how much of revenue trickles down into earnings which illustrates how efficient the business is with its cost management. Asset turnover reveals how much revenue can be generated from Stamps.com’s asset base. The most interesting ratio, and reflective of sustainability of its ROE, is financial leverage. Since ROE can be inflated by excessive debt, we need to examine Stamps.com’s debt-to-equity level. At 15.25%, Stamps.com’s debt-to-equity ratio appears low and indicates the above-average ROE is generated from its capacity to increase profit without a large debt burden.

Next Steps:
ROE is one of many ratios which meaningfully dissects financial statements, which illustrates the quality of a company. Stamps.com exhibits a strong ROE against its peers, as well as sufficient returns to cover its cost of equity. Its high ROE is not likely to be driven by high debt. Therefore, investors may have more confidence in the sustainability of this level of returns going forward. Although ROE can be a useful metric, it is only a small part of diligent research.
For Stamps.com, I’ve compiled three important aspects you should further examine:
Financial Health: Does it have a healthy balance sheet? Take a look at our free balance sheet analysis with six simple checks on key factors like leverage and risk.
Valuation: What is Stamps.com worth today? Is the stock undervalued, even when its growth outlook is factored into its intrinsic value? The intrinsic value infographic in our free research report helps visualize whether Stamps.com is currently mispriced by the market.
Other High-Growth Alternatives : Are there other high-growth stocks you could be holding instead of Stamps.com? Explore our interactive list of stocks with large growth potential to get an idea of what else is out there you may be missing!
To help readers see pass the short term volatility of the financial market, we aim to bring you a long-term focused research analysis purely driven by fundamental data. Note that our analysis does not factor in the latest price sensitive company announcements.
The author is an independent contributor and at the time of publication had no position in the stocks mentioned.
