
 Yahoo Finance
 Do Directors Own Air New Zealand Limited (NZSE:AIR) Shares?

If you want to know who really controls Air New Zealand Limited (NZSE:AIR), then you'll have to look at the makeup of its share registry. Insiders often own a large chunk of younger, smaller, companies while huge companies tend to have institutions as shareholders. Companies that have been privatized tend to have low insider ownership.
With a market capitalization of NZ$3.2b, Air New Zealand is a decent size, so it is probably on the radar of institutional investors. Taking a look at our data on the ownership groups (below), it's seems that institutions own shares in the company. Let's delve deeper into each type of owner, to discover more about AIR.
Check out our latest analysis for Air New Zealand

What Does The Institutional Ownership Tell Us About Air New Zealand?
Institutional investors commonly compare their own returns to the returns of a commonly followed index. So they generally do consider buying larger companies that are included in the relevant benchmark index.
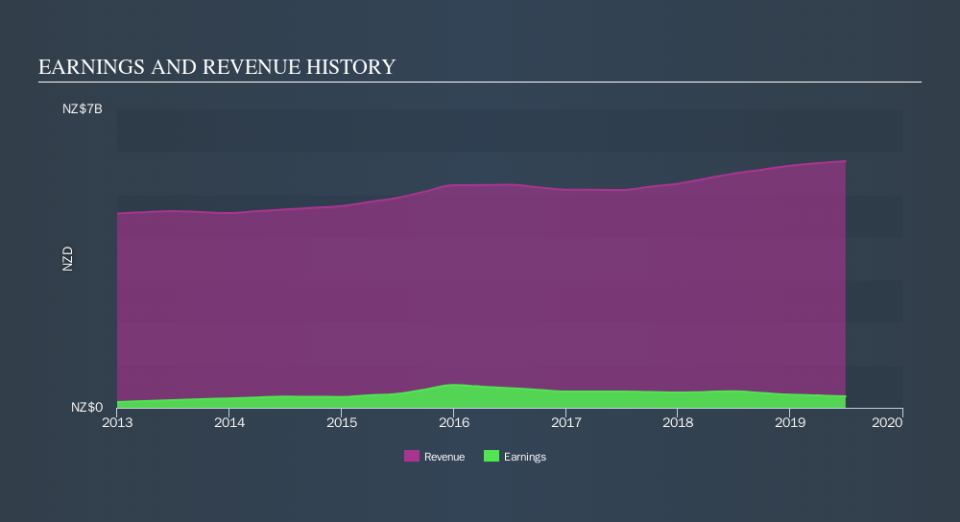
We can see that Air New Zealand does have institutional investors; and they hold 27% of the stock. This implies the analysts working for those institutions have looked at the stock and they like it. But just like anyone else, they could be wrong. If multiple institutions change their view on a stock at the same time, you could see the share price drop fast. It's therefore worth looking at Air New Zealand's earnings history, below. Of course, the future is what really matters.
We note that hedge funds don't have a meaningful investment in Air New Zealand. Quite a few analysts cover the stock, so you could look into forecast growth quite easily.
Insider Ownership Of Air New Zealand
The definition of an insider can differ slightly between different countries, but members of the board of directors always count. Management ultimately answers to the board. However, it is not uncommon for managers to be executive board members, especially if they are a founder or the CEO.
Insider ownership is positive when it signals leadership are thinking like the true owners of the company. However, high insider ownership can also give immense power to a small group within the company. This can be negative in some circumstances.
Our most recent data indicates that insiders own less than 1% of Air New Zealand Limited. Keep in mind that it's a big company, and the insiders own NZ$25m worth of shares. The absolute value might be more important than the proportional share. It is always good to see at least some insider ownership, but it might be worth checking if those insiders have been selling.
General Public Ownership
The general public, with a 20% stake in the company, will not easily be ignored. While this size of ownership may not be enough to sway a policy decision in their favour, they can still make a collective impact on company policies.
Next Steps:
I find it very interesting to look at who exactly owns a company. But to truly gain insight, we need to consider other information, too.
I always like to check for a history of revenue growth. You can too, by accessing this free chart of historic revenue and earnings in this detailed graph.
If you are like me, you may want to think about whether this company will grow or shrink. Luckily, you can check this free report showing analyst forecasts for its future.
NB: Figures in this article are calculated using data from the last twelve months, which refer to the 12-month period ending on the last date of the month the financial statement is dated. This may not be consistent with full year annual report figures.
We aim to bring you long-term focused research analysis driven by fundamental data. Note that our analysis may not factor in the latest price-sensitive company announcements or qualitative material.
If you spot an error that warrants correction, please contact the editor at editorial-team@simplywallst.com. This article by Simply Wall St is general in nature. It does not constitute a recommendation to buy or sell any stock, and does not take account of your objectives, or your financial situation. Simply Wall St has no position in the stocks mentioned. Thank you for reading.
