
 Yahoo Finance
 Does CHF Solutions Inc’s (NASDAQ:CHFS) Past Performance Indicate A Weaker Future?

When CHF Solutions Inc’s (NASDAQ:CHFS) announced its latest earnings (31 March 2018), I wanted to understand how these figures stacked up against its past performance. The two benchmarks I used were CHF Solutions’s average earnings over the past couple of years, and its industry performance. These are useful yardsticks to help me gauge whether or not CHFS actually performed well. Below is a quick commentary on how I see CHFS has performed. Check out our latest analysis for CHF Solutions
Did CHFS perform worse than its track record and industry?
I use the ‘latest twelve-month’ data, which annualizes the most recent half-year data, or in some cases, the latest annual report is already the most recent financial year data. This method enables me to analyze various companies on a similar basis, using new information. For CHF Solutions, its most recent trailing-twelve-month earnings is -US$26.56M, which, against the previous year’s level, has become more negative. Since these figures are somewhat short-term thinking, I’ve determined an annualized five-year value for CHF Solutions’s earnings, which stands at -US$20.13M. This doesn’t seem to paint a better picture, as earnings seem to have gradually been getting more and more negative over time.
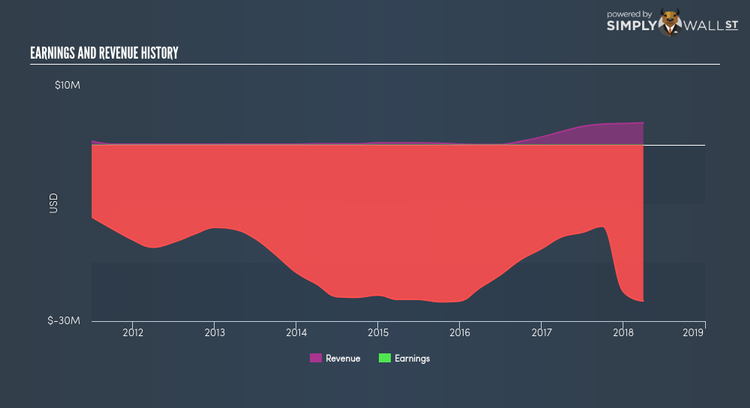
We can further analyze CHF Solutions’s loss by looking at what the industry has been experiencing over the past few years. Each year, for the past half a decade CHF Solutions’s top-line has increased by 51.50% on average, implying that the company is in a high-growth phase with expenses racing ahead revenues, leading to annual losses. Viewing growth from a sector-level, the US medical equipment industry has been growing, albeit, at a subdued single-digit rate of 7.93% in the previous year, and 9.15% over the last five years. This means that whatever tailwind the industry is deriving benefit from, CHF Solutions has not been able to leverage it as much as its industry peers.
What does this mean?
Though CHF Solutions’s past data is helpful, it is only one aspect of my investment thesis. With companies that are currently loss-making, it is always difficult to forecast what will happen in the future and when. The most insightful step is to examine company-specific issues CHF Solutions may be facing and whether management guidance has consistently been met in the past. You should continue to research CHF Solutions to get a more holistic view of the stock by looking at:
Future Outlook: What are well-informed industry analysts predicting for CHFS’s future growth? Take a look at our free research report of analyst consensus for CHFS’s outlook.
Financial Health: Is CHFS’s operations financially sustainable? Balance sheets can be hard to analyze, which is why we’ve done it for you. Check out our financial health checks here.
Other High-Performing Stocks: Are there other stocks that provide better prospects with proven track records? Explore our free list of these great stocks here.
NB: Figures in this article are calculated using data from the trailing twelve months from 31 March 2018. This may not be consistent with full year annual report figures.
To help readers see pass the short term volatility of the financial market, we aim to bring you a long-term focused research analysis purely driven by fundamental data. Note that our analysis does not factor in the latest price sensitive company announcements.
The author is an independent contributor and at the time of publication had no position in the stocks mentioned.
