
 Yahoo Finance
 Does The Cooper Companies Inc’s (NYSE:COO) Debt Level Pose A Problem?

Investors pursuing a solid, dependable stock investment can often be led to The Cooper Companies Inc (NYSE:COO), a large-cap worth US$12.94b. Market participants who are conscious of risk tend to search for large firms, attracted by the prospect of varied revenue sources and strong returns on capital. However, its financial health remains the key to continued success. Let’s take a look at Cooper Companies’s leverage and assess its financial strength to get an idea of their ability to fund strategic acquisitions and grow through cyclical pressures. Remember this is a very top-level look that focuses exclusively on financial health, so I recommend a deeper analysis into COO here.
See our latest analysis for Cooper Companies
How does COO’s operating cash flow stack up against its debt?
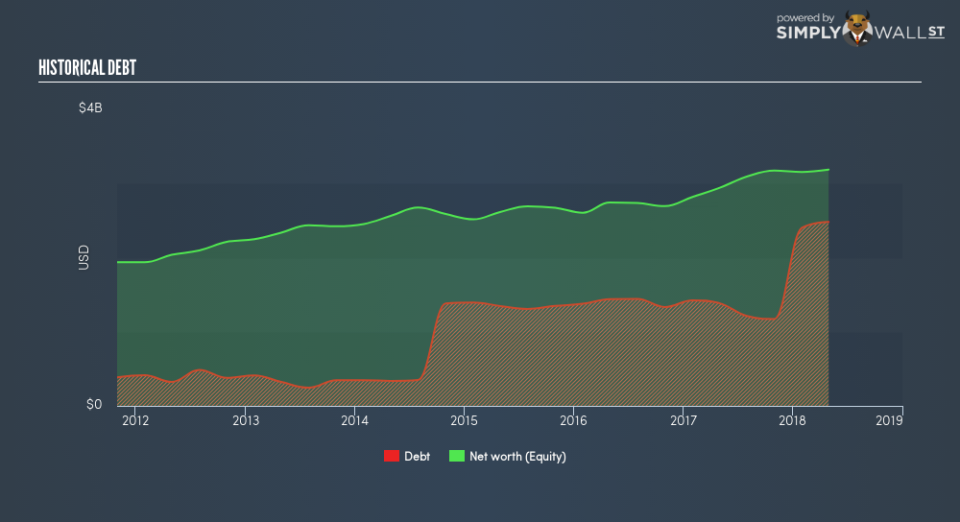
COO has built up its total debt levels in the last twelve months, from US$1.39b to US$2.48b – this includes both the current and long-term debt. With this rise in debt, COO’s cash and short-term investments stands at US$164.9m , ready to deploy into the business. Additionally, COO has produced cash from operations of US$550.6m in the last twelve months, leading to an operating cash to total debt ratio of 22.2%, meaning that COO’s debt is appropriately covered by operating cash. This ratio can also be a sign of operational efficiency as an alternative to return on assets. In COO’s case, it is able to generate 0.22x cash from its debt capital.
Can COO pay its short-term liabilities?
With current liabilities at US$460.4m, it appears that the company has been able to meet these obligations given the level of current assets of US$1.27b, with a current ratio of 2.76x. For Medical Equipment companies, this ratio is within a sensible range since there’s sufficient cash cushion without leaving too much capital idle or in low-earning investments.
Does COO face the risk of succumbing to its debt-load?
With debt reaching 77.9% of equity, COO may be thought of as relatively highly levered. This isn’t surprising for large-caps, as equity can often be more expensive to issue than debt, plus interest payments are tax deductible. Consequently, larger-cap organisations tend to enjoy lower cost of capital as a result of easily attained financing, providing an advantage over smaller companies. We can assess the sustainability of COO’s debt levels to the test by looking at how well interest payments are covered by earnings. Preferably, earnings before interest and tax (EBIT) should be at least three times as large as net interest. For COO, the ratio of 9.37x suggests that interest is appropriately covered. High interest coverage serves as an indication of the safety of a company, which highlights why many large organisations like COO are considered a risk-averse investment.
Next Steps:
COO’s debt and cash flow levels indicate room for improvement. Its cash flow coverage of less than a quarter of debt means that operating efficiency could be an issue. However, the company exhibits an ability to meet its near-term obligations, which isn’t a big surprise for a large-cap. Keep in mind I haven’t considered other factors such as how COO has been performing in the past. I recommend you continue to research Cooper Companies to get a more holistic view of the stock by looking at:
Future Outlook: What are well-informed industry analysts predicting for COO’s future growth? Take a look at our free research report of analyst consensus for COO’s outlook.
Valuation: What is COO worth today? Is the stock undervalued, even when its growth outlook is factored into its intrinsic value? The intrinsic value infographic in our free research report helps visualize whether COO is currently mispriced by the market.
Other High-Performing Stocks: Are there other stocks that provide better prospects with proven track records? Explore our free list of these great stocks here.
To help readers see past the short term volatility of the financial market, we aim to bring you a long-term focused research analysis purely driven by fundamental data. Note that our analysis does not factor in the latest price-sensitive company announcements.
The author is an independent contributor and at the time of publication had no position in the stocks mentioned. For errors that warrant correction please contact the editor at editorial-team@simplywallst.com.
