
 Yahoo Finance
 Does discoverIE Group plc's (LON:DSCV) Weak Fundamentals Mean A Downturn In Its Stock Should Be Expected?
Most readers would already know that discoverIE Group's (LON:DSCV) stock increased by 6.1% over the past three months. However, its weak financial performance indicators makes us a bit doubtful if that trend could continue. Specifically, we decided to study discoverIE Group's ROE in this article.
Return on equity or ROE is an important factor to be considered by a shareholder because it tells them how effectively their capital is being reinvested. Put another way, it reveals the company's success at turning shareholder investments into profits.
See our latest analysis for discoverIE Group
How Is ROE Calculated?
ROE can be calculated by using the formula:
Return on Equity = Net Profit (from continuing operations) ÷ Shareholders' Equity
So, based on the above formula, the ROE for discoverIE Group is:
5.6% = UK£17m ÷ UK£313m (Based on the trailing twelve months to September 2022).
The 'return' is the profit over the last twelve months. One way to conceptualize this is that for each £1 of shareholders' capital it has, the company made £0.06 in profit.
What Is The Relationship Between ROE And Earnings Growth?
We have already established that ROE serves as an efficient profit-generating gauge for a company's future earnings. Depending on how much of these profits the company reinvests or "retains", and how effectively it does so, we are then able to assess a company’s earnings growth potential. Assuming all else is equal, companies that have both a higher return on equity and higher profit retention are usually the ones that have a higher growth rate when compared to companies that don't have the same features.
discoverIE Group's Earnings Growth And 5.6% ROE
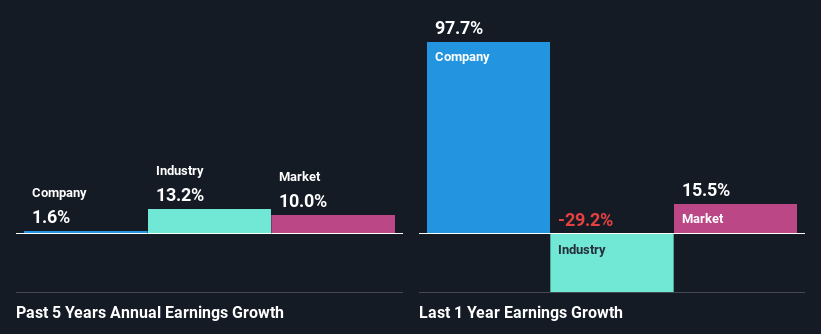
When you first look at it, discoverIE Group's ROE doesn't look that attractive. We then compared the company's ROE to the broader industry and were disappointed to see that the ROE is lower than the industry average of 14%. Therefore, discoverIE Group's flat earnings over the past five years can possibly be explained by the low ROE amongst other factors.
As a next step, we compared discoverIE Group's net income growth with the industry and were disappointed to see that the company's growth is lower than the industry average growth of 13% in the same period.
Earnings growth is a huge factor in stock valuation. It’s important for an investor to know whether the market has priced in the company's expected earnings growth (or decline). This then helps them determine if the stock is placed for a bright or bleak future. One good indicator of expected earnings growth is the P/E ratio which determines the price the market is willing to pay for a stock based on its earnings prospects. So, you may want to check if discoverIE Group is trading on a high P/E or a low P/E, relative to its industry.
Is discoverIE Group Making Efficient Use Of Its Profits?
discoverIE Group has a high three-year median payout ratio of 61% (or a retention ratio of 39%), meaning that the company is paying most of its profits as dividends to its shareholders. This does go some way in explaining why there's been no growth in its earnings.
Additionally, discoverIE Group has paid dividends over a period of at least ten years, which means that the company's management is determined to pay dividends even if it means little to no earnings growth. Our latest analyst data shows that the future payout ratio of the company is expected to drop to 38% over the next three years. The fact that the company's ROE is expected to rise to 11% over the same period is explained by the drop in the payout ratio.
Conclusion
In total, we would have a hard think before deciding on any investment action concerning discoverIE Group. Because the company is not reinvesting much into the business, and given the low ROE, it's not surprising to see the lack or absence of growth in its earnings. With that said, the latest industry analyst forecasts reveal that the company's earnings are expected to accelerate. To know more about the latest analysts predictions for the company, check out this visualization of analyst forecasts for the company.
Have feedback on this article? Concerned about the content? Get in touch with us directly. Alternatively, email editorial-team (at) simplywallst.com.
This article by Simply Wall St is general in nature. We provide commentary based on historical data and analyst forecasts only using an unbiased methodology and our articles are not intended to be financial advice. It does not constitute a recommendation to buy or sell any stock, and does not take account of your objectives, or your financial situation. We aim to bring you long-term focused analysis driven by fundamental data. Note that our analysis may not factor in the latest price-sensitive company announcements or qualitative material. Simply Wall St has no position in any stocks mentioned.
Join A Paid User Research Session
You’ll receive a US$30 Amazon Gift card for 1 hour of your time while helping us build better investing tools for the individual investors like yourself. Sign up here
