
 Yahoo Finance
 Does Eastman Chemical Company's (NYSE:EMN) CEO Pay Matter?

In 2014 Mark Costa was appointed CEO of Eastman Chemical Company (NYSE:EMN). First, this article will compare CEO compensation with compensation at other large companies. After that, we will consider the growth in the business. Third, we'll reflect on the total return to shareholders over three years, as a second measure of business performance. This method should give us information to assess how appropriately the company pays the CEO.
View our latest analysis for Eastman Chemical
How Does Mark Costa's Compensation Compare With Similar Sized Companies?
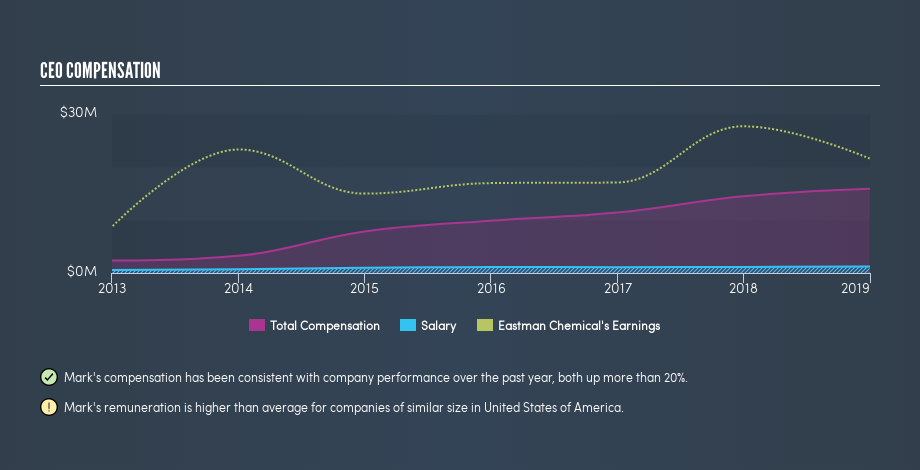
According to our data, Eastman Chemical Company has a market capitalization of US$11b, and pays its CEO total annual compensation worth US$16m. (This figure is for the year to December 2018). While this analysis focuses on total compensation, it's worth noting the salary is lower, valued at US$1.2m. We took a group of companies with market capitalizations over US$8.0b, and calculated the median CEO total compensation to be US$11m. There aren't very many mega-cap companies, so we had to take a wide range to get a meaningful comparison figure.
Thus we can conclude that Mark Costa receives more in total compensation than the median of a group of large companies in the same market as Eastman Chemical Company. However, this doesn't necessarily mean the pay is too high. A closer look at the performance of the underlying business will give us a better idea about whether the pay is particularly generous.
You can see a visual representation of the CEO compensation at Eastman Chemical, below.
Is Eastman Chemical Company Growing?
Eastman Chemical Company has increased its earnings per share (EPS) by an average of 12% a year, over the last three years (using a line of best fit). It saw its revenue drop -3.9% over the last year.
This demonstrates that the company has been improving recently. A good result. Revenue growth is a real positive for growth, but ultimately profits are more important. You might want to check this free visual report on analyst forecasts for future earnings.
Has Eastman Chemical Company Been A Good Investment?
With a total shareholder return of 29% over three years, Eastman Chemical Company shareholders would, in general, be reasonably content. But they would probably prefer not to see CEO compensation far in excess of the median.
In Summary...
We examined the amount Eastman Chemical Company pays its CEO, and compared it to the amount paid by other large companies. As discussed above, we discovered that the company pays more than the median of that group.
Importantly, though, the company has impressed with its earnings per share growth, over three years. We also note that, over the same time frame, shareholder returns haven't been bad. You might wish to research management further, but on this analysis, considering the EPS growth, we wouldn't call the CEO pay problematic. If you think CEO compensation levels are interesting you will probably really like this free visualization of insider trading at Eastman Chemical.
If you want to buy a stock that is better than Eastman Chemical, this free list of high return, low debt companies is a great place to look.
We aim to bring you long-term focused research analysis driven by fundamental data. Note that our analysis may not factor in the latest price-sensitive company announcements or qualitative material.
If you spot an error that warrants correction, please contact the editor at editorial-team@simplywallst.com. This article by Simply Wall St is general in nature. It does not constitute a recommendation to buy or sell any stock, and does not take account of your objectives, or your financial situation. Simply Wall St has no position in the stocks mentioned. Thank you for reading.
