
 Yahoo Finance
 Does GOL Linhas Aéreas Inteligentes SA.’s (NYSE:GOL) -98.69% Earnings Drop Reflect A Longer Term Trend?

Assessing GOL Linhas Aéreas Inteligentes SA.’s (NYSE:GOL) past track record of performance is an insightful exercise for investors. It allows us to reflect on whether or not the company has met or exceed expectations, which is a great indicator for future performance. Today I will assess GOL’s recent performance announced on 31 March 2018 and evaluate these figures to its long-term trend and industry movements. See our latest analysis for GOL Linhas Aéreas Inteligentes
How Well Did GOL Perform?
I prefer to use the ‘latest twelve-month’ data, which either annualizes the most recent 6-month earnings update, or in some cases, the most recent annual report is already the latest available financial data. This technique allows me to analyze different stocks on a more comparable basis, using the most relevant data points. For GOL Linhas Aéreas Inteligentes, its latest earnings (trailing twelve month) is R$4.07M, which, against the prior year’s figure, has taken a dive by a non-trivial -98.69%. Since these figures may be fairly short-term, I have computed an annualized five-year figure for GOL’s net income, which stands at -R$1.12B This means despite the fact that earnings declined from the prior year, over a longer period of time, GOL Linhas Aéreas Inteligentes’s earnings have been increasing on average.
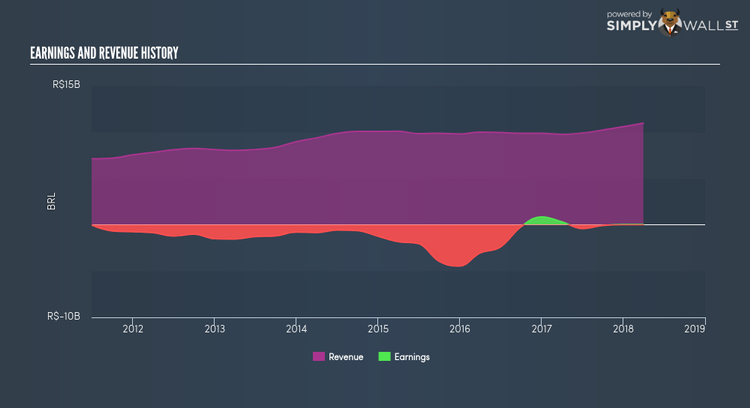
What’s enabled this growth? Let’s see whether it is solely due to an industry uplift, or if GOL Linhas Aéreas Inteligentes has seen some company-specific growth. The climb in earnings seems to be bolstered by a solid top-line increase outpacing its growth rate of costs. Though this has caused a margin contraction, it has made GOL Linhas Aéreas Inteligentes more profitable. Inspecting growth from a sector-level, the US airlines industry has been growing its average earnings by double-digit 38.40% in the prior year, and 19.66% over the last five years. This means that any uplift the industry is deriving benefit from, GOL Linhas Aéreas Inteligentes has not been able to reap as much as its industry peers.
What does this mean?
While past data is useful, it doesn’t tell the whole story. Companies that are profitable, but have volatile earnings, can have many factors impacting its business. I recommend you continue to research GOL Linhas Aéreas Inteligentes to get a better picture of the stock by looking at:
Future Outlook: What are well-informed industry analysts predicting for GOL’s future growth? Take a look at our free research report of analyst consensus for GOL’s outlook.
Financial Health: Is GOL’s operations financially sustainable? Balance sheets can be hard to analyze, which is why we’ve done it for you. Check out our financial health checks here.
Other High-Performing Stocks: Are there other stocks that provide better prospects with proven track records? Explore our free list of these great stocks here.
NB: Figures in this article are calculated using data from the trailing twelve months from 31 March 2018. This may not be consistent with full year annual report figures.
To help readers see pass the short term volatility of the financial market, we aim to bring you a long-term focused research analysis purely driven by fundamental data. Note that our analysis does not factor in the latest price sensitive company announcements.
The author is an independent contributor and at the time of publication had no position in the stocks mentioned.
