
 Yahoo Finance
 What Does Hengan International Group Company Limited’s (HKG:1044) P/E Ratio Tell You?

The goal of this article is to teach you how to use price to earnings ratios (P/E ratios). To keep it practical, we’ll show how Hengan International Group Company Limited’s (HKG:1044) P/E ratio could help you assess the value on offer. Hengan International Group has a price to earnings ratio of 17.8, based on the last twelve months. In other words, at today’s prices, investors are paying HK$17.8 for every HK$1 in prior year profit.
See our latest analysis for Hengan International Group
How Do You Calculate Hengan International Group’s P/E Ratio?
The formula for P/E is:
Price to Earnings Ratio = Price per Share (in the reporting currency) ÷ Earnings per Share (EPS)
Or for Hengan International Group:
P/E of 17.8 = CN¥57.39 (Note: this is the share price in the reporting currency, namely, CNY ) ÷ CN¥3.22 (Based on the year to June 2018.)
Is A High P/E Ratio Good?
A higher P/E ratio means that investors are paying a higher price for each HK$1 of company earnings. All else being equal, it’s better to pay a low price — but as Warren Buffett said, ‘It’s far better to buy a wonderful company at a fair price than a fair company at a wonderful price.’
How Growth Rates Impact P/E Ratios
Earnings growth rates have a big influence on P/E ratios. Earnings growth means that in the future the ‘E’ will be higher. That means even if the current P/E is high, it will reduce over time if the share price stays flat. So while a stock may look expensive based on past earnings, it could be cheap based on future earnings.
Hengan International Group saw earnings per share improve by -9.7% last year. And earnings per share have improved by 6.3% annually, over the last five years.
How Does Hengan International Group’s P/E Ratio Compare To Its Peers?
We can get an indication of market expectations by looking at the P/E ratio. You can see in the image below that the average P/E (15.8) for companies in the personal products industry is lower than Hengan International Group’s P/E.
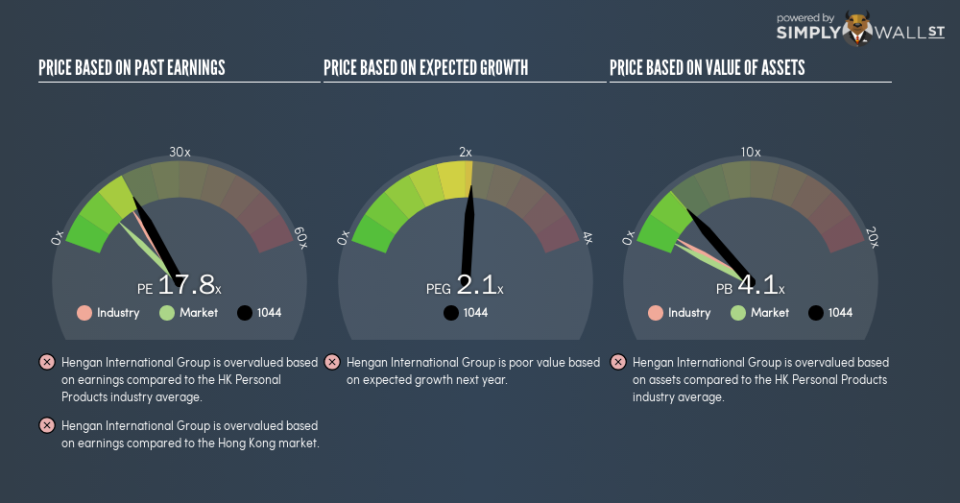
That means that the market expects Hengan International Group will outperform other companies in its industry. The market is optimistic about the future, but that doesn’t guarantee future growth. So further research is always essential. I often monitor director buying and selling.
Don’t Forget: The P/E Does Not Account For Debt or Bank Deposits
The ‘Price’ in P/E reflects the market capitalization of the company. That means it doesn’t take debt or cash into account. In theory, a company can lower its future P/E ratio by using cash or debt to invest in growth.
Such expenditure might be good or bad, in the long term, but the point here is that the balance sheet is not reflected by this ratio.
Is Debt Impacting Hengan International Group’s P/E?
Hengan International Group’s net debt is 0.4% of its market cap. The market might award it a higher P/E ratio if it had net cash, but its unlikely this low level of net borrowing is having a big impact on the P/E multiple.
The Bottom Line On Hengan International Group’s P/E Ratio
Hengan International Group trades on a P/E ratio of 17.8, which is above the HK market average of 10.7. Given the debt is only modest, and earnings are already moving in the right direction, it’s not surprising that the market expects continued improvement.
When the market is wrong about a stock, it gives savvy investors an opportunity. People often underestimate remarkable growth — so investors can make money when fast growth is not fully appreciated. So this free visual report on analyst forecasts could hold they key to an excellent investment decision.
Of course, you might find a fantastic investment by looking at a few good candidates. So take a peek at this free list of companies with modest (or no) debt, trading on a P/E below 20.
To help readers see past the short term volatility of the financial market, we aim to bring you a long-term focused research analysis purely driven by fundamental data. Note that our analysis does not factor in the latest price-sensitive company announcements.
The author is an independent contributor and at the time of publication had no position in the stocks mentioned. For errors that warrant correction please contact the editor at editorial-team@simplywallst.com.
