
 Yahoo Finance
 How Does Henry Schein's (NASDAQ:HSIC) P/E Compare To Its Industry, After The Share Price Drop?

Unfortunately for some shareholders, the Henry Schein (NASDAQ:HSIC) share price has dived 30% in the last thirty days. The recent drop has obliterated the annual return, with the share price now down 17% over that longer period.
All else being equal, a share price drop should make a stock more attractive to potential investors. In the long term, share prices tend to follow earnings per share, but in the short term prices bounce around in response to short term factors (which are not always obvious). So, on certain occasions, long term focussed investors try to take advantage of pessimistic expectations to buy shares at a better price. One way to gauge market expectations of a stock is to look at its Price to Earnings Ratio (PE Ratio). A high P/E implies that investors have high expectations of what a company can achieve compared to a company with a low P/E ratio.
Check out our latest analysis for Henry Schein
How Does Henry Schein's P/E Ratio Compare To Its Peers?
Henry Schein's P/E of 10.70 indicates relatively low sentiment towards the stock. The image below shows that Henry Schein has a lower P/E than the average (16.7) P/E for companies in the healthcare industry.
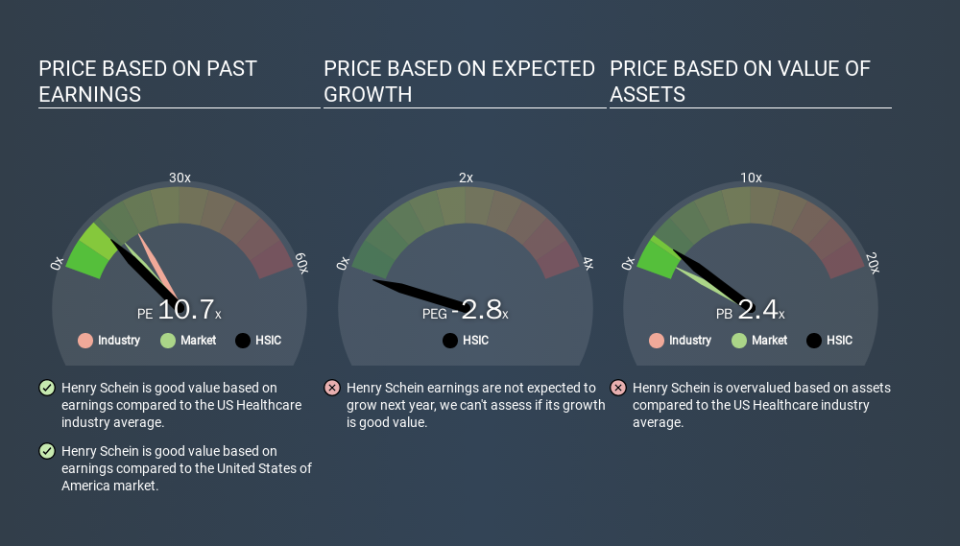
This suggests that market participants think Henry Schein will underperform other companies in its industry. Since the market seems unimpressed with Henry Schein, it's quite possible it could surprise on the upside. You should delve deeper. I like to check if company insiders have been buying or selling.
How Growth Rates Impact P/E Ratios
Probably the most important factor in determining what P/E a company trades on is the earnings growth. When earnings grow, the 'E' increases, over time. That means even if the current P/E is high, it will reduce over time if the share price stays flat. And as that P/E ratio drops, the company will look cheap, unless its share price increases.
In the last year, Henry Schein grew EPS like Taylor Swift grew her fan base back in 2010; the 69% gain was both fast and well deserved. Having said that, if we look back three years, EPS growth has averaged a comparatively less impressive 15%.
Remember: P/E Ratios Don't Consider The Balance Sheet
One drawback of using a P/E ratio is that it considers market capitalization, but not the balance sheet. That means it doesn't take debt or cash into account. Hypothetically, a company could reduce its future P/E ratio by spending its cash (or taking on debt) to achieve higher earnings.
Spending on growth might be good or bad a few years later, but the point is that the P/E ratio does not account for the option (or lack thereof).
So What Does Henry Schein's Balance Sheet Tell Us?
Henry Schein has net debt worth just 8.9% of its market capitalization. So it doesn't have as many options as it would with net cash, but its debt would not have much of an impact on its P/E ratio.
The Verdict On Henry Schein's P/E Ratio
Henry Schein's P/E is 10.7 which is below average (11.8) in the US market. The company hasn't stretched its balance sheet, and earnings growth was good last year. If it continues to grow, then the current low P/E may prove to be unjustified. What can be absolutely certain is that the market has become less optimistic about Henry Schein over the last month, with the P/E ratio falling from 15.4 back then to 10.7 today. For those who prefer to invest with the flow of momentum, that might be a bad sign, but for a contrarian, it may signal opportunity.
When the market is wrong about a stock, it gives savvy investors an opportunity. If it is underestimating a company, investors can make money by buying and holding the shares until the market corrects itself. So this free report on the analyst consensus forecasts could help you make a master move on this stock.
You might be able to find a better buy than Henry Schein. If you want a selection of possible winners, check out this free list of interesting companies that trade on a P/E below 20 (but have proven they can grow earnings).
If you spot an error that warrants correction, please contact the editor at editorial-team@simplywallst.com. This article by Simply Wall St is general in nature. It does not constitute a recommendation to buy or sell any stock, and does not take account of your objectives, or your financial situation. Simply Wall St has no position in the stocks mentioned.
We aim to bring you long-term focused research analysis driven by fundamental data. Note that our analysis may not factor in the latest price-sensitive company announcements or qualitative material. Thank you for reading.
