
 Yahoo Finance
 What does Koninklijke Philips NV’s (AMS:PHIA) Balance Sheet Tell Us About Its Future?

Investors seeking to preserve capital in a volatile environment might consider large-cap stocks such as Koninklijke Philips NV (AMS:PHIA) a safer option. Doing business globally, large caps tend to have diversified revenue streams and attractive capital returns, making them desirable investments for risk-averse portfolios. However, its financial health remains the key to continued success. I will provide an overview of Koninklijke Philips’s financial liquidity and leverage to give you an idea of Koninklijke Philips’s position to take advantage of potential acquisitions or comfortably endure future downturns. Note that this information is centred entirely on financial health and is a high-level overview, so I encourage you to look further into PHIA here.
Check out our latest analysis for Koninklijke Philips
Does PHIA produce enough cash relative to debt?
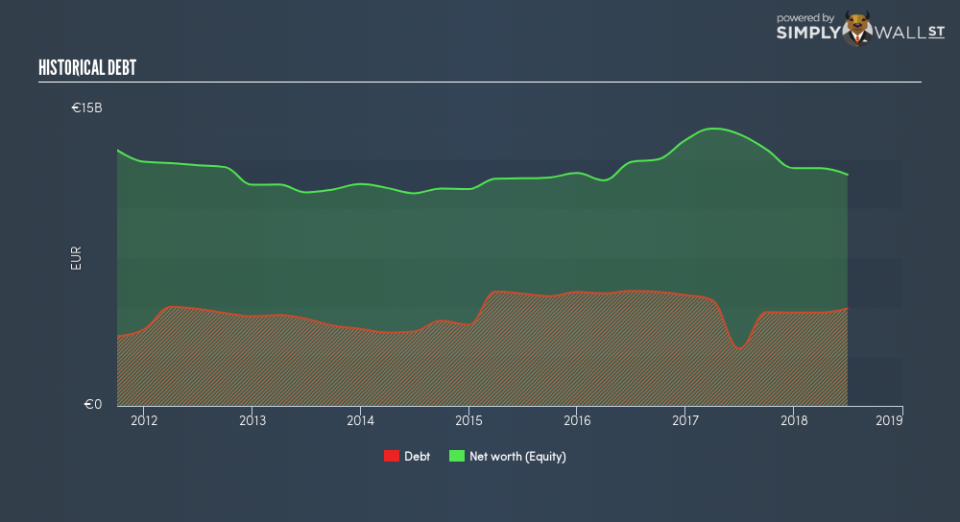
PHIA has built up its total debt levels in the last twelve months, from €2.90b to €4.93b – this includes both the current and long-term debt. With this increase in debt, PHIA’s cash and short-term investments stands at €1.62b for investing into the business. Additionally, PHIA has generated €2.23b in operating cash flow during the same period of time, resulting in an operating cash to total debt ratio of 45.3%, meaning that PHIA’s current level of operating cash is high enough to cover debt. This ratio can also be interpreted as a measure of efficiency as an alternative to return on assets. In PHIA’s case, it is able to generate 0.45x cash from its debt capital.
Does PHIA’s liquid assets cover its short-term commitments?
At the current liabilities level of €7.12b liabilities, the company has been able to meet these obligations given the level of current assets of €9.06b, with a current ratio of 1.27x. For Medical Equipment companies, this ratio is within a sensible range since there’s sufficient cash cushion without leaving too much capital idle or in low-earning investments.
Is PHIA’s debt level acceptable?
With debt reaching 42.1% of equity, PHIA may be thought of as relatively highly levered. This isn’t uncommon for large companies because interest payments on debt are tax deductible, meaning debt can be a cheaper source of capital than equity. Since large-caps are seen as safer than their smaller constituents, they tend to enjoy lower cost of capital. We can check to see whether PHIA is able to meet its debt obligations by looking at the net interest coverage ratio. Ideally, earnings before interest and tax (EBIT) should cover net interest by at least three times. In PHIA’s case, the ratio of 25.4x suggests that interest is comfortably covered. Large-cap investments like PHIA are often believed to be a safe investment due to their ability to pump out ample earnings multiple times its interest payments.
Next Steps:
Although PHIA’s debt level is towards the higher end of the spectrum, its cash flow coverage seems adequate to meet obligations which means its debt is being efficiently utilised. Since there is also no concerns around PHIA’s liquidity needs, this may be its optimal capital structure for the time being. Keep in mind I haven’t considered other factors such as how PHIA has been performing in the past. I recommend you continue to research Koninklijke Philips to get a more holistic view of the large-cap by looking at:
Future Outlook: What are well-informed industry analysts predicting for PHIA’s future growth? Take a look at our free research report of analyst consensus for PHIA’s outlook.
Valuation: What is PHIA worth today? Is the stock undervalued, even when its growth outlook is factored into its intrinsic value? The intrinsic value infographic in our free research report helps visualize whether PHIA is currently mispriced by the market.
Other High-Performing Stocks: Are there other stocks that provide better prospects with proven track records? Explore our free list of these great stocks here.
To help readers see past the short term volatility of the financial market, we aim to bring you a long-term focused research analysis purely driven by fundamental data. Note that our analysis does not factor in the latest price-sensitive company announcements.
The author is an independent contributor and at the time of publication had no position in the stocks mentioned. For errors that warrant correction please contact the editor at editorial-team@simplywallst.com.
