
 Yahoo Finance
 What does Mercury NZ Limited's (NZSE:MCY) Balance Sheet Tell Us About Its Future?

Want to participate in a short research study? Help shape the future of investing tools and you could win a $250 gift card!
Small-caps and large-caps are wildly popular among investors; however, mid-cap stocks, such as Mercury NZ Limited (NZSE:MCY) with a market-capitalization of NZ$5.3b, rarely draw their attention. Despite this, the two other categories have lagged behind the risk-adjusted returns of commonly ignored mid-cap stocks. Today we will look at MCY’s financial liquidity and debt levels, which are strong indicators for whether the company can weather economic downturns or fund strategic acquisitions for future growth. Note that this information is centred entirely on financial health and is a top-level understanding, so I encourage you to look further into MCY here.
Check out our latest analysis for Mercury NZ
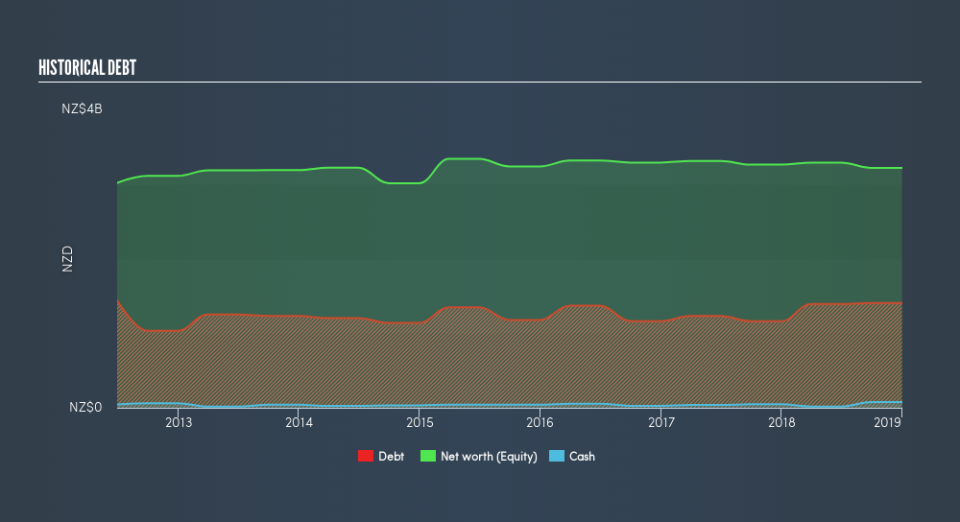
MCY’s Debt (And Cash Flows)
MCY's debt levels surged from NZ$1.2b to NZ$1.4b over the last 12 months , which includes long-term debt. With this rise in debt, the current cash and short-term investment levels stands at NZ$78m to keep the business going. On top of this, MCY has generated cash from operations of NZ$325m in the last twelve months, leading to an operating cash to total debt ratio of 23%, meaning that MCY’s current level of operating cash is high enough to cover debt.
Can MCY pay its short-term liabilities?
At the current liabilities level of NZ$583m, the company arguably has a rather low level of current assets relative its obligations, with the current ratio last standing at 0.88x. The current ratio is calculated by dividing current assets by current liabilities.
Is MCY’s debt level acceptable?
With a debt-to-equity ratio of 44%, MCY can be considered as an above-average leveraged company. This is not unusual for mid-caps as debt tends to be a cheaper and faster source of funding for some businesses. We can test if MCY’s debt levels are sustainable by measuring interest payments against earnings of a company. Ideally, earnings before interest and tax (EBIT) should cover net interest by at least three times. For MCY, the ratio of 4.34x suggests that interest is appropriately covered, which means that lenders may be inclined to lend more money to the company, as it is seen as safe in terms of payback.
Next Steps:
MCY’s high cash coverage means that, although its debt levels are high, the company is able to utilise its borrowings efficiently in order to generate cash flow. However, its low liquidity raises concerns over whether current asset management practices are properly implemented for the mid-cap. This is only a rough assessment of financial health, and I'm sure MCY has company-specific issues impacting its capital structure decisions. You should continue to research Mercury NZ to get a better picture of the stock by looking at:
Future Outlook: What are well-informed industry analysts predicting for MCY’s future growth? Take a look at our free research report of analyst consensus for MCY’s outlook.
Valuation: What is MCY worth today? Is the stock undervalued, even when its growth outlook is factored into its intrinsic value? The intrinsic value infographic in our free research report helps visualize whether MCY is currently mispriced by the market.
Other High-Performing Stocks: Are there other stocks that provide better prospects with proven track records? Explore our free list of these great stocks here.
We aim to bring you long-term focused research analysis driven by fundamental data. Note that our analysis may not factor in the latest price-sensitive company announcements or qualitative material.
If you spot an error that warrants correction, please contact the editor at editorial-team@simplywallst.com. This article by Simply Wall St is general in nature. It does not constitute a recommendation to buy or sell any stock, and does not take account of your objectives, or your financial situation. Simply Wall St has no position in the stocks mentioned. Thank you for reading.
