
 Yahoo Finance
 What Does NAHL Group plc’s (LON:NAH) Ownership Structure Look Like?

A look at the shareholders of NAHL Group plc (LON:NAH) can tell us which group is most powerful. Generally speaking, as a company grows, institutions will increase their ownership. Conversely, insiders often decrease their ownership over time. Companies that have been privatized tend to have low insider ownership.
NAHL Group is not a large company by global standards. It has a market capitalization of UK£50.1m, which means it wouldn’t have the attention of many institutional investors. Taking a look at the our data on the ownership groups (below), it’s seems that institutions own shares in the company. We can zoom in on the different ownership groups, to learn more about NAH.
Check out our latest analysis for NAHL Group
What Does The Institutional Ownership Tell Us About NAHL Group?
Many institutions measure their performance against an index that approximates the local market. So they usually pay more attention to companies that are included in major indices.
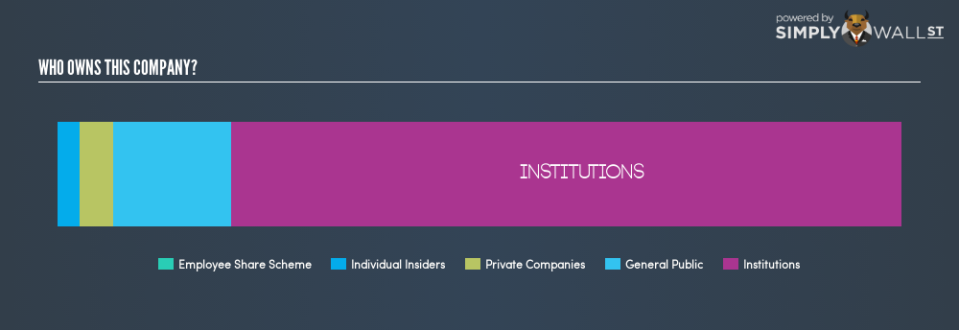
As you can see, institutional investors own 79.4% of NAHL Group. This implies the analysts working for those institutions have looked at the stock and they like it. But just like anyone else, they could be wrong. When multiple institutions own a stock, there’s always a risk that they are in a ‘crowded trade’. When such a trade goes wrong, multiple parties may compete to sell stock fast. This risk is higher in a company without a history of growth. You can see NAHL Group’s historic earnings and revenue, below, but keep in mind there’s always more to the story.

Since institutional investors own more than half the issued stock, the board will likely have to pay attention to their preferences. Hedge funds don’t have many shares in NAHL Group. There is some analyst coverage of the stock, but it could still become more well known, with time.
Insider Ownership Of NAHL Group
The definition of company insiders can be subjective, and does vary between jurisdictions. Our data reflects individual insiders, capturing board members at the very least. Company management run the business, but the CEO will answer to the board, even if he or she is a member of it.
Insider ownership is positive when it signals leadership are thinking like the true owners of the company. However, high insider ownership can also give immense power to a small group within the company. This can be negative in some circumstances. Shareholders would probably be interested to learn that insiders own shares in NAHL Group plc. As individuals, the insiders collectively own UK£1.3m worth of the UK£50.1m company. It is good to see some investment by insiders, but I usually like to see higher insider holdings. It might be worth checking if those insiders have been buying.
General Public Ownership
The general public holds a 13.9% stake in NAH. While this group can’t necessarily call the shots, it can certainly have a real influence on how the company is run.
Private Company Ownership
We can see that Private Companies own 4.0%, of the shares on issue. It’s hard to draw any conclusions from this fact alone, so its worth looking into who owns those private companies. Sometimes insiders or other related parties have an interest in shares in a public company through a separate private company.
Next Steps:
It’s always worth thinking about the different groups who own shares in a company. But to understand NAHL Group better, we need to consider many other factors.
Many find it useful to take an in depth look at how a company has performed in the past. You can access this detailed graph of past earnings, revenue and cash flow .
If you would prefer discover what analysts are predicting in terms of future growth, do not miss this free report on analyst forecasts.
NB: Figures in this article are calculated using data from the last twelve months, which refer to the 12-month period ending on the last date of the month the financial statement is dated. This may not be consistent with full year annual report figures.
To help readers see past the short term volatility of the financial market, we aim to bring you a long-term focused research analysis purely driven by fundamental data. Note that our analysis does not factor in the latest price-sensitive company announcements.
The author is an independent contributor and at the time of publication had no position in the stocks mentioned. For errors that warrant correction please contact the editor at editorial-team@simplywallst.com.
