
 Yahoo Finance
 How Does PCSB Financial's (NASDAQ:PCSB) P/E Compare To Its Industry, After The Share Price Drop?

To the annoyance of some shareholders, PCSB Financial (NASDAQ:PCSB) shares are down a considerable 33% in the last month. That drop has capped off a tough year for shareholders, with the share price down 32% in that time.
All else being equal, a share price drop should make a stock more attractive to potential investors. In the long term, share prices tend to follow earnings per share, but in the short term prices bounce around in response to short term factors (which are not always obvious). The implication here is that long term investors have an opportunity when expectations of a company are too low. Perhaps the simplest way to get a read on investors' expectations of a business is to look at its Price to Earnings Ratio (PE Ratio). Investors have optimistic expectations of companies with higher P/E ratios, compared to companies with lower P/E ratios.
View our latest analysis for PCSB Financial
Does PCSB Financial Have A Relatively High Or Low P/E For Its Industry?
We can tell from its P/E ratio of 24.78 that there is some investor optimism about PCSB Financial. The image below shows that PCSB Financial has a higher P/E than the average (10.9) P/E for companies in the mortgage industry.
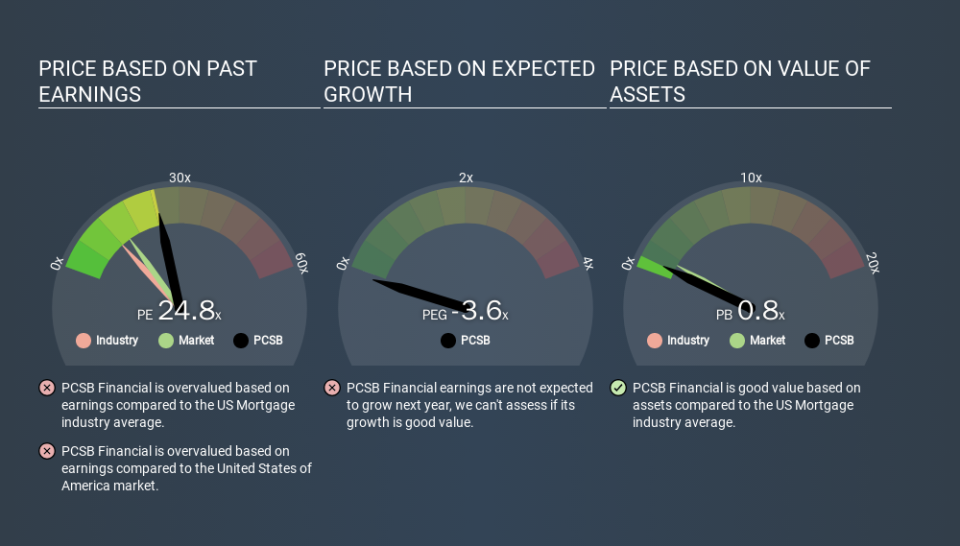
Its relatively high P/E ratio indicates that PCSB Financial shareholders think it will perform better than other companies in its industry classification. Clearly the market expects growth, but it isn't guaranteed. So further research is always essential. I often monitor director buying and selling.
How Growth Rates Impact P/E Ratios
Generally speaking the rate of earnings growth has a profound impact on a company's P/E multiple. That's because companies that grow earnings per share quickly will rapidly increase the 'E' in the equation. And in that case, the P/E ratio itself will drop rather quickly. Then, a lower P/E should attract more buyers, pushing the share price up.
PCSB Financial saw earnings per share decrease by 2.0% last year.
A Limitation: P/E Ratios Ignore Debt and Cash In The Bank
The 'Price' in P/E reflects the market capitalization of the company. In other words, it does not consider any debt or cash that the company may have on the balance sheet. In theory, a company can lower its future P/E ratio by using cash or debt to invest in growth.
Such spending might be good or bad, overall, but the key point here is that you need to look at debt to understand the P/E ratio in context.
How Does PCSB Financial's Debt Impact Its P/E Ratio?
PCSB Financial has net debt worth 11% of its market capitalization. That's enough debt to impact the P/E ratio a little; so keep it in mind if you're comparing it to companies without debt.
The Verdict On PCSB Financial's P/E Ratio
PCSB Financial has a P/E of 24.8. That's higher than the average in its market, which is 13.3. With some debt but no EPS growth last year, the market has high expectations of future profits. Given PCSB Financial's P/E ratio has declined from 36.7 to 24.8 in the last month, we know for sure that the market is significantly less confident about the business today, than it was back then. For those who don't like to trade against momentum, that could be a warning sign, but a contrarian investor might want to take a closer look.
Investors have an opportunity when market expectations about a stock are wrong. People often underestimate remarkable growth -- so investors can make money when fast growth is not fully appreciated. So this free report on the analyst consensus forecasts could help you make a master move on this stock.
But note: PCSB Financial may not be the best stock to buy. So take a peek at this free list of interesting companies with strong recent earnings growth (and a P/E ratio below 20).
If you spot an error that warrants correction, please contact the editor at editorial-team@simplywallst.com. This article by Simply Wall St is general in nature. It does not constitute a recommendation to buy or sell any stock, and does not take account of your objectives, or your financial situation. Simply Wall St has no position in the stocks mentioned.
We aim to bring you long-term focused research analysis driven by fundamental data. Note that our analysis may not factor in the latest price-sensitive company announcements or qualitative material. Thank you for reading.
