
 Yahoo Finance
 Does Taylor Wimpey plc (LON:TW.) Have A Good P/E Ratio?

This article is written for those who want to get better at using price to earnings ratios (P/E ratios). To keep it practical, we’ll show how Taylor Wimpey plc’s (LON:TW.) P/E ratio could help you assess the value on offer. Based on the last twelve months, Taylor Wimpey’s P/E ratio is 6.9. In other words, at today’s prices, investors are paying £6.9 for every £1 in prior year profit.
Check out our latest analysis for Taylor Wimpey
How Do I Calculate A Price To Earnings Ratio?
The formula for price to earnings is:
Price to Earnings Ratio = Price per Share ÷ Earnings per Share (EPS)
Or for Taylor Wimpey:
P/E of 6.9 = £1.34 ÷ £0.19 (Based on the year to July 2018.)
Is A High P/E Ratio Good?
A higher P/E ratio means that investors are paying a higher price for each £1 of company earnings. That isn’t a good or a bad thing on its own, but a high P/E means that buyers have a higher opinion of the business’s prospects, relative to stocks with a lower P/E.
How Growth Rates Impact P/E Ratios
P/E ratios primarily reflect market expectations around earnings growth rates. Earnings growth means that in the future the ‘E’ will be higher. That means unless the share price increases, the P/E will reduce in a few years. A lower P/E should indicate the stock is cheap relative to others — and that may attract buyers.
Most would be impressed by Taylor Wimpey earnings growth of 17% in the last year. And its annual EPS growth rate over 5 years is 19%. With that performance, you might expect an above average P/E ratio.
How Does Taylor Wimpey’s P/E Ratio Compare To Its Peers?
The P/E ratio essentially measures market expectations of a company. The image below shows that Taylor Wimpey has a lower P/E than the average (11.2) P/E for companies in the consumer durables industry.
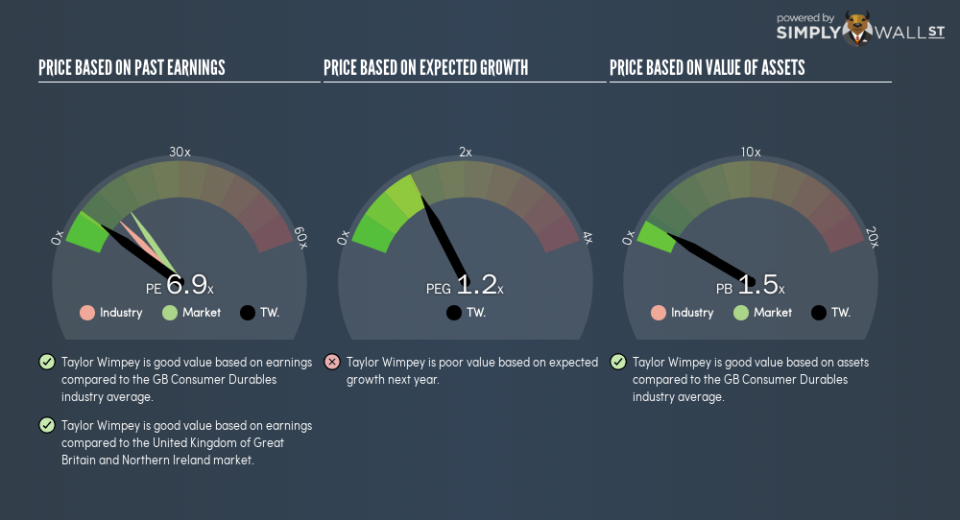
Its relatively low P/E ratio indicates that Taylor Wimpey shareholders think it will struggle to do as well as other companies in its industry classification. Many investors like to buy stocks when the market is pessimistic about their prospects. You should delve deeper. I like to check if company insiders have been buying or selling.
Don’t Forget: The P/E Does Not Account For Debt or Bank Deposits
Don’t forget that the P/E ratio considers market capitalization. In other words, it does not consider any debt or cash that the company may have on the balance sheet. In theory, a company can lower its future P/E ratio by using cash or debt to invest in growth.
Such expenditure might be good or bad, in the long term, but the point here is that the balance sheet is not reflected by this ratio.
How Does Taylor Wimpey’s Debt Impact Its P/E Ratio?
The extra options and safety that comes with Taylor Wimpey’s UK£496m net cash position means that it deserves a higher P/E than it would if it had a lot of net debt.
The Bottom Line On Taylor Wimpey’s P/E Ratio
Taylor Wimpey’s P/E is 6.9 which is below average (15.2) in the GB market. Not only should the net cash position reduce risk, but the recent growth has been impressive. One might conclude that the market is a bit pessimistic, given the low P/E ratio. Because analysts are predicting more growth in the future, one might have expected to see a higher P/E ratio. You can taker closer look at the fundamentals, here.
Investors should be looking to buy stocks that the market is wrong about. If it is underestimating a company, investors can make money by buying and holding the shares until the market corrects itself. So this free visualization of the analyst consensus on future earnings could help you make the right decision about whether to buy, sell, or hold.
But note: Taylor Wimpey may not be the best stock to buy. So take a peek at this free list of interesting companies with strong recent earnings growth (and a P/E ratio below 20).
To help readers see past the short term volatility of the financial market, we aim to bring you a long-term focused research analysis purely driven by fundamental data. Note that our analysis does not factor in the latest price-sensitive company announcements.
The author is an independent contributor and at the time of publication had no position in the stocks mentioned. For errors that warrant correction please contact the editor at editorial-team@simplywallst.com.
