
 Yahoo Finance
 Does Vista Group International Limited’s (NZSE:VGL) PE Ratio Warrant A Sell?

The content of this article will benefit those of you who are starting to educate yourself about investing in the stock market and want to start learning about core concepts of fundamental analysis on practical examples from today’s market.
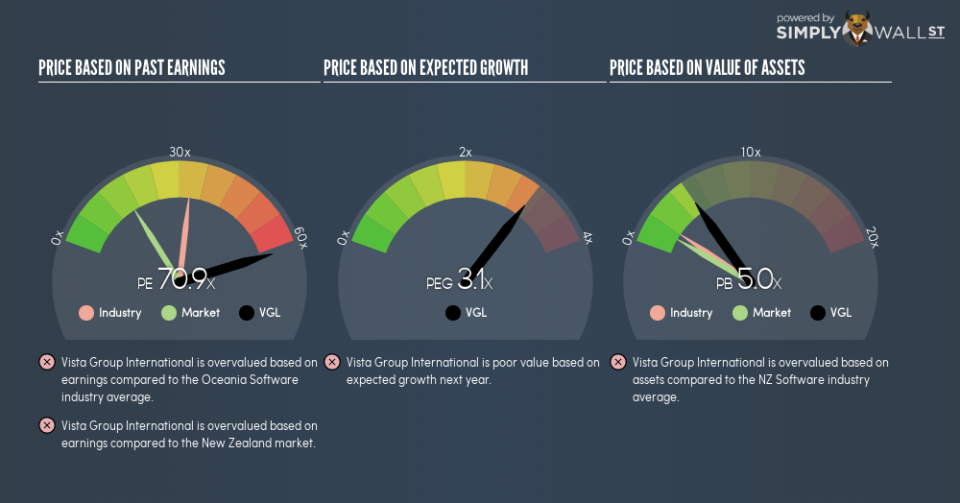
Vista Group International Limited (NZSE:VGL) trades with a trailing P/E of 70.9, which is higher than the industry average of 33.6. While this might not seem positive, it is important to understand the assumptions behind the P/E ratio before you make any investment decisions. In this article, I will deconstruct the P/E ratio and highlight what you need to be careful of when using the P/E ratio.
View our latest analysis for Vista Group International
Demystifying the P/E ratio
The P/E ratio is one of many ratios used in relative valuation. It compares a stock’s price per share to the stock’s earnings per share. A more intuitive way of understanding the P/E ratio is to think of it as how much investors are paying for each dollar of the company’s earnings.
P/E Calculation for VGL
Price-Earnings Ratio = Price per share ÷ Earnings per share
VGL Price-Earnings Ratio = NZ$4.17 ÷ NZ$0.0588 = 70.9x
The P/E ratio itself doesn’t tell you a lot; however, it becomes very insightful when you compare it with other similar companies. We preferably want to compare the stock’s P/E ratio to the average of companies that have similar features to VGL, such as capital structure and profitability. One way of gathering a peer group is to use firms in the same industry, which is what I’ll do. VGL’s P/E of 70.9 is higher than its industry peers (33.6), which implies that each dollar of VGL’s earnings is being overvalued by investors. Since the Software sector in NZ is relatively small, I’ve included similar companies in the wider region in order to get a better idea of the multiple, which is a median of profitable companies of companies such as Enprise Group, Finzsoft Solutions and . You could also say that the market is suggesting that VGL is a stronger business than the average comparable company.
Assumptions to watch out for
Before you jump to conclusions it is important to realise that there are assumptions in this analysis. The first is that our “similar companies” are actually similar to VGL. If not, the difference in P/E might be a result of other factors. For example, Vista Group International Limited could be growing more quickly than the companies we’re comparing it with. In that case it would deserve a higher P/E ratio. We should also be aware that the stocks we are comparing to VGL may not be fairly valued. Just because it is trading on a higher P/E ratio than its peers does not mean it must be overvalued. After all, the peer group could be undervalued.
What this means for you:
You may have already conducted fundamental analysis on the stock as a shareholder, so its current overvaluation could signal a potential selling opportunity to reduce your exposure to VGL. Now that you understand the ins and outs of the PE metric, you should know to bear in mind its limitations before you make an investment decision. Remember that basing your investment decision off one metric alone is certainly not sufficient. There are many things I have not taken into account in this article and the PE ratio is very one-dimensional. If you have not done so already, I highly recommend you to complete your research by taking a look at the following:
Future Outlook: What are well-informed industry analysts predicting for VGL’s future growth? Take a look at our free research report of analyst consensus for VGL’s outlook.
Past Track Record: Has VGL been consistently performing well irrespective of the ups and downs in the market? Go into more detail in the past performance analysis and take a look at the free visual representations of VGL’s historicals for more clarity.
Other High-Performing Stocks: Are there other stocks that provide better prospects with proven track records? Explore our free list of these great stocks here.
To help readers see past the short term volatility of the financial market, we aim to bring you a long-term focused research analysis purely driven by fundamental data. Note that our analysis does not factor in the latest price-sensitive company announcements.
The author is an independent contributor and at the time of publication had no position in the stocks mentioned. For errors that warrant correction please contact the editor at editorial-team@simplywallst.com.
