
 Yahoo Finance
 How Does Wharf Real Estate Investment Company Limited (HKG:1997) Fare As A Dividend Stock?

Today we'll take a closer look at Wharf Real Estate Investment Company Limited (HKG:1997) from a dividend investor's perspective. Owning a strong business and reinvesting the dividends is widely seen as an attractive way of growing your wealth. Unfortunately, it's common for investors to be enticed in by the seemingly attractive yield, and lose money when the company has to cut its dividend payments.
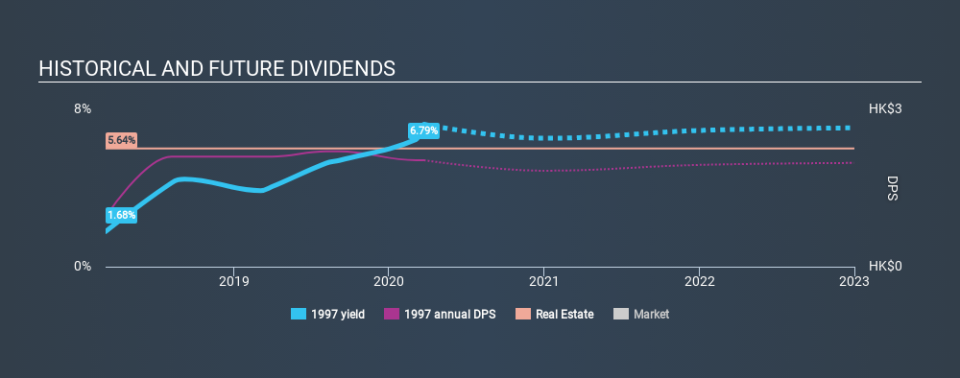
In this case, Wharf Real Estate Investment pays a decent-sized 6.8% dividend yield, and has been distributing cash to shareholders for the past two years. It's certainly an attractive yield, but readers are likely curious about its staying power. Remember though, given the recent drop in its share price, Wharf Real Estate Investment's yield will look higher, even though the market may now be expecting a decline in its long-term prospects. Some simple research can reduce the risk of buying Wharf Real Estate Investment for its dividend - read on to learn more.
Explore this interactive chart for our latest analysis on Wharf Real Estate Investment!
Payout ratios
Companies (usually) pay dividends out of their earnings. If a company is paying more than it earns, the dividend might have to be cut. Comparing dividend payments to a company's net profit after tax is a simple way of reality-checking whether a dividend is sustainable. In the last year, Wharf Real Estate Investment paid out 157% of its profit as dividends. A payout ratio above 100% is definitely an item of concern, unless there are some other circumstances that would justify it.
Is Wharf Real Estate Investment's Balance Sheet Risky?
As Wharf Real Estate Investment's dividend was not well covered by earnings, we need to check its balance sheet for signs of financial distress. A quick check of its financial situation can be done with two ratios: net debt divided by EBITDA (earnings before interest, tax, depreciation and amortisation), and net interest cover. Net debt to EBITDA is a measure of a company's total debt. Net interest cover measures the ability to meet interest payments. Essentially we check that a) the company does not have too much debt, and b) that it can afford to pay the interest. Wharf Real Estate Investment has net debt of 3.24 times its EBITDA, which is getting towards the limit of most investors' comfort zones. Judicious use of debt can enhance shareholder returns, but also adds to the risk if something goes awry.
We calculated its interest cover by measuring its earnings before interest and tax (EBIT), and dividing this by the company's net interest expense. With EBIT of 13.57 times its interest expense, Wharf Real Estate Investment's interest cover is quite strong - more than enough to cover the interest expense.
Remember, you can always get a snapshot of Wharf Real Estate Investment's latest financial position, by checking our visualisation of its financial health.
Dividend Volatility
One of the major risks of relying on dividend income, is the potential for a company to struggle financially and cut its dividend. Not only is your income cut, but the value of your investment declines as well - nasty. The company has been paying a stable dividend for a few years now, but we'd like to see more evidence of consistency over a longer period. During the past two-year period, the first annual payment was HK$0.95 in 2018, compared to HK$2.03 last year. This works out to be a compound annual growth rate (CAGR) of approximately 46% a year over that time.
Wharf Real Estate Investment has been growing its dividend quite rapidly, which is exciting. However, the short payment history makes us question whether this performance will persist across a full market cycle.
Dividend Growth Potential
Dividend payments have been consistent over the past few years, but we should always check if earnings per share (EPS) are growing, as this will help maintain the purchasing power of the dividend. Wharf Real Estate Investment's earnings per share have shrunk at 27% a year over the past three years. With this kind of significant decline, we always wonder what has changed in the business. Dividends are about stability, and Wharf Real Estate Investment's earnings per share, which support the dividend, have been anything but stable.
Conclusion
When we look at a dividend stock, we need to form a judgement on whether the dividend will grow, if the company is able to maintain it in a wide range of economic circumstances, and if the dividend payout is sustainable. First, it's not great to see how much of its earnings are being paid as dividends. Earnings per share are down, and to our mind Wharf Real Estate Investment has not been paying a dividend long enough to demonstrate its resilience across economic cycles. With this information in mind, we think Wharf Real Estate Investment may not be an ideal dividend stock.
Investors generally tend to favour companies with a consistent, stable dividend policy as opposed to those operating an irregular one. Still, investors need to consider a host of other factors, apart from dividend payments, when analysing a company. Taking the debate a bit further, we've identified 4 warning signs for Wharf Real Estate Investment that investors need to be conscious of moving forward.
Looking for more high-yielding dividend ideas? Try our curated list of dividend stocks with a yield above 3%.
If you spot an error that warrants correction, please contact the editor at editorial-team@simplywallst.com. This article by Simply Wall St is general in nature. It does not constitute a recommendation to buy or sell any stock, and does not take account of your objectives, or your financial situation. Simply Wall St has no position in the stocks mentioned.
We aim to bring you long-term focused research analysis driven by fundamental data. Note that our analysis may not factor in the latest price-sensitive company announcements or qualitative material. Thank you for reading.
