
 Yahoo Finance
 Dollar Downward Slipping may Continue on the Fear of Trade War?
US dollar will probably continue its downtrend on the fear of a potential trade war caused by the US tariffs annulment on imported steel and aluminum.
Despite the fact that the fear of a trade war starts fading away, some elements on the technical side are still there and could support the continuation of the downtrend. At the moment, the dollar index is not showing pullback elements, as the US dollar continued going downwards during the past days.
It should be taken into consideration the US Core Consumer Price Index (CPI) that was released yesterday in line with analysts expectations and the surprising firing of US secretary of State Tillerson.
US Dollar Index Technical View
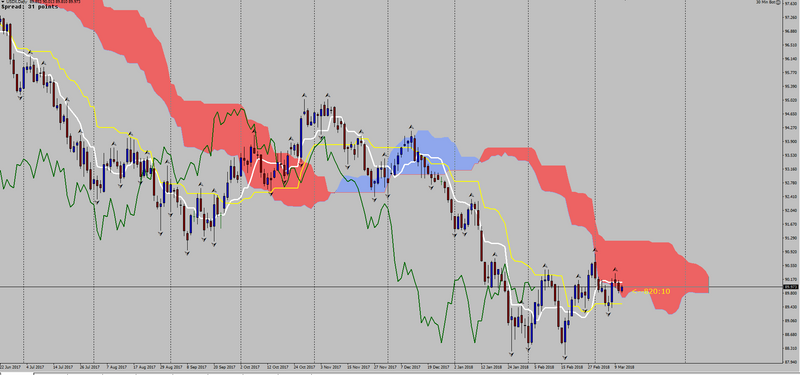
On the daily timeframe of the technical view, it could be observed that the downtrend is still strong and that there is a thick Kumo. Furthermore, we can see that there is strong resistance. On the contrary, the price crossed the Tekan Sen and Kijun Sen lines, as well as, the Chickou span in the price.
We may see that a reversal price found resistance on the Tekan Sen line and started heading down. However, these elements could be an indication of an early potential reversal, given that we break out of the Kumo to the upside.
The chart below shows how this opportunity could be potentially used, provided that the price breaks the Kijun Sen and the Tekan Sen lines, and forms a bearish down formation.
This article was written by Marios Athinodorou, TeleTrade’s market analyst, and commentator. Among others, Marios is delivering weekly trading webinars. Sign up for upcoming webinars here.
This article was originally posted on FX Empire
