
 Yahoo Finance
 Don’t Sell BHP Billiton plc (LON:BLT) Before You Read This

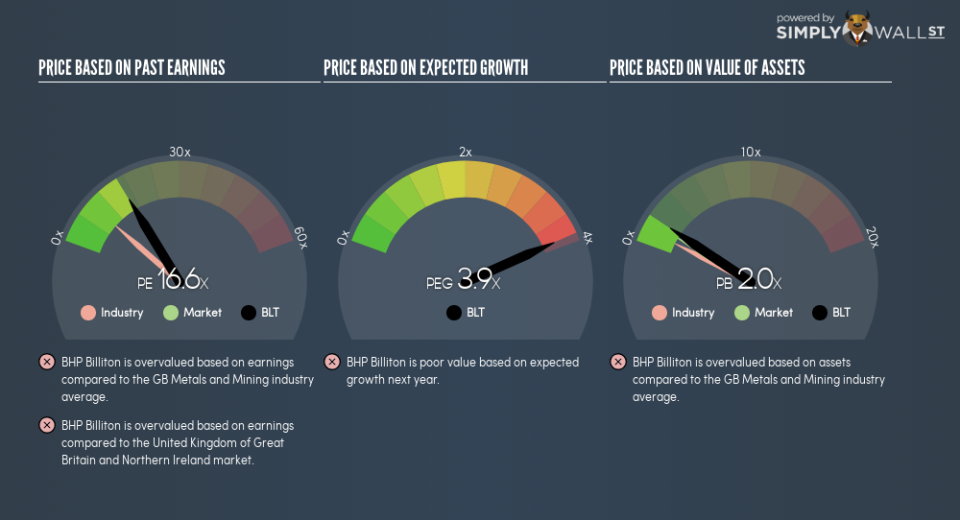
This article is written for those who want to get better at using price to earnings ratios (P/E ratios). We’ll look at BHP Billiton plc’s (LON:BLT) P/E ratio and reflect on what it tells us about the company’s share price. BHP Billiton has a price to earnings ratio of 16.55, based on the last twelve months. That means that at current prices, buyers pay £16.55 for every £1 in trailing yearly profits.
See our latest analysis for BHP Billiton
How Do You Calculate BHP Billiton’s P/E Ratio?
The formula for price to earnings is:
Price to Earnings Ratio = Price per Share (in the reporting currency) ÷ Earnings per Share (EPS)
Or for BHP Billiton:
P/E of 16.55 = $20.61 (Note: this is the share price in the reporting currency, namely, USD ) ÷ $1.24 (Based on the trailing twelve months to June 2018.)
Is A High P/E Ratio Good?
A higher P/E ratio implies that investors pay a higher price for the earning power of the business. That is not a good or a bad thing per se, but a high P/E does imply buyers are optimistic about the future.
How Growth Rates Impact P/E Ratios
Earnings growth rates have a big influence on P/E ratios. Earnings growth means that in the future the ‘E’ will be higher. That means unless the share price increases, the P/E will reduce in a few years. Then, a lower P/E should attract more buyers, pushing the share price up.
BHP Billiton saw earnings per share improve by -4.2% last year. And its annual EPS growth rate over 3 years is 79%. But earnings per share are down 30% per year over the last five years.
How Does BHP Billiton’s P/E Ratio Compare To Its Peers?
The P/E ratio essentially measures market expectations of a company. As you can see below, BHP Billiton has a higher P/E than the average company (9.2) in the metals and mining industry.
That means that the market expects BHP Billiton will outperform other companies in its industry. Shareholders are clearly optimistic, but the future is always uncertain. So investors should always consider the P/E ratio alongside other factors, such as whether company directors have been buying shares.
Don’t Forget: The P/E Does Not Account For Debt or Bank Deposits
It’s important to note that the P/E ratio considers the market capitalization, not the enterprise value. Thus, the metric does not reflect cash or debt held by the company. Theoretically, a business can improve its earnings (and produce a lower P/E in the future), by taking on debt (or spending its remaining cash).
Such expenditure might be good or bad, in the long term, but the point here is that the balance sheet is not reflected by this ratio.
How Does BHP Billiton’s Debt Impact Its P/E Ratio?
Net debt totals 11% of BHP Billiton’s market cap. That’s enough debt to impact the P/E ratio a little; so keep it in mind if you’re comparing it to companies without debt.
The Bottom Line On BHP Billiton’s P/E Ratio
BHP Billiton trades on a P/E ratio of 16.6, which is fairly close to the GB market average of 16.4. When you consider the modest EPS growth last year (along with some debt), it seems the market thinks the growth is sustainable.
Investors should be looking to buy stocks that the market is wrong about. As value investor Benjamin Graham famously said, ‘In the short run, the market is a voting machine but in the long run, it is a weighing machine.’ So this free visual report on analyst forecasts could hold they key to an excellent investment decision.
Of course, you might find a fantastic investment by looking at a few good candidates. So take a peek at this free list of companies with modest (or no) debt, trading on a P/E below 20.
To help readers see past the short term volatility of the financial market, we aim to bring you a long-term focused research analysis purely driven by fundamental data. Note that our analysis does not factor in the latest price-sensitive company announcements.
The author is an independent contributor and at the time of publication had no position in the stocks mentioned. For errors that warrant correction please contact the editor at editorial-team@simplywallst.com.
