
 Yahoo Finance
 Don't Sell Adobe Inc. (NASDAQ:ADBE) Before You Read This

Today, we'll introduce the concept of the P/E ratio for those who are learning about investing. To keep it practical, we'll show how Adobe Inc.'s (NASDAQ:ADBE) P/E ratio could help you assess the value on offer. What is Adobe's P/E ratio? Well, based on the last twelve months it is 48.70. That means that at current prices, buyers pay $48.70 for every $1 in trailing yearly profits.
Check out our latest analysis for Adobe
How Do You Calculate Adobe's P/E Ratio?
The formula for price to earnings is:
Price to Earnings Ratio = Price per Share รท Earnings per Share (EPS)
Or for Adobe:
P/E of 48.70 = $277.54 รท $5.70 (Based on the trailing twelve months to August 2019.)
Is A High Price-to-Earnings Ratio Good?
A higher P/E ratio means that buyers have to pay a higher price for each $1 the company has earned over the last year. All else being equal, it's better to pay a low price -- but as Warren Buffett said, 'It's far better to buy a wonderful company at a fair price than a fair company at a wonderful price.
Does Adobe Have A Relatively High Or Low P/E For Its Industry?
We can get an indication of market expectations by looking at the P/E ratio. You can see in the image below that the average P/E (45.2) for companies in the software industry is lower than Adobe's P/E.
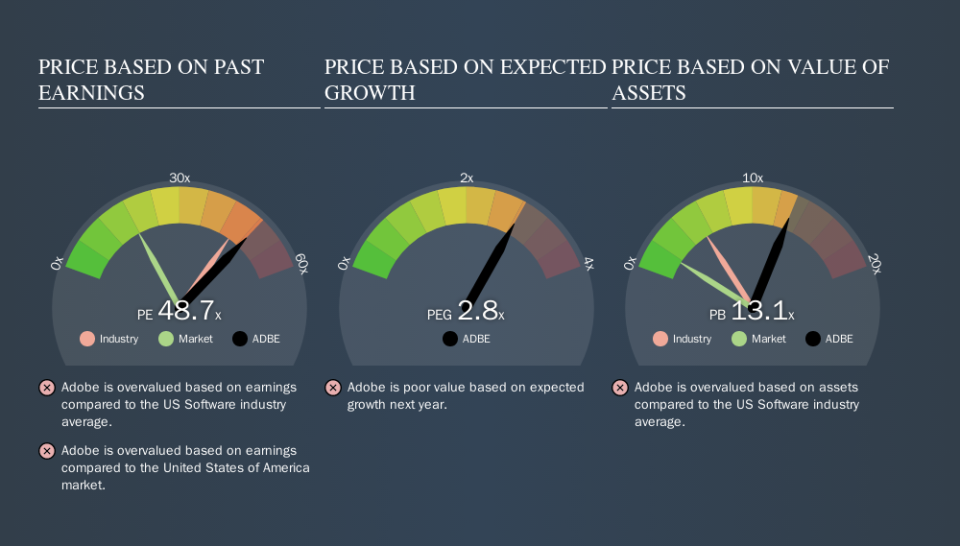
Adobe's P/E tells us that market participants think the company will perform better than its industry peers, going forward. Clearly the market expects growth, but it isn't guaranteed. So investors should delve deeper. I like to check if company insiders have been buying or selling.
How Growth Rates Impact P/E Ratios
Earnings growth rates have a big influence on P/E ratios. If earnings are growing quickly, then the 'E' in the equation will increase faster than it would otherwise. That means unless the share price increases, the P/E will reduce in a few years. And as that P/E ratio drops, the company will look cheap, unless its share price increases.
Most would be impressed by Adobe earnings growth of 16% in the last year. And its annual EPS growth rate over 5 years is 63%. With that performance, you might expect an above average P/E ratio.
A Limitation: P/E Ratios Ignore Debt and Cash In The Bank
One drawback of using a P/E ratio is that it considers market capitalization, but not the balance sheet. That means it doesn't take debt or cash into account. In theory, a company can lower its future P/E ratio by using cash or debt to invest in growth.
Such expenditure might be good or bad, in the long term, but the point here is that the balance sheet is not reflected by this ratio.
How Does Adobe's Debt Impact Its P/E Ratio?
Net debt totals just 0.4% of Adobe's market cap. The market might award it a higher P/E ratio if it had net cash, but its unlikely this low level of net borrowing is having a big impact on the P/E multiple.
The Bottom Line On Adobe's P/E Ratio
Adobe's P/E is 48.7 which is above average (17.8) in its market. The company is not overly constrained by its modest debt levels, and its recent EPS growth very solid. So on this analysis it seems reasonable that its P/E ratio is above average.
Investors should be looking to buy stocks that the market is wrong about. People often underestimate remarkable growth -- so investors can make money when fast growth is not fully appreciated. So this free visualization of the analyst consensus on future earnings could help you make the right decision about whether to buy, sell, or hold.
But note: Adobe may not be the best stock to buy. So take a peek at this free list of interesting companies with strong recent earnings growth (and a P/E ratio below 20).
We aim to bring you long-term focused research analysis driven by fundamental data. Note that our analysis may not factor in the latest price-sensitive company announcements or qualitative material.
If you spot an error that warrants correction, please contact the editor at editorial-team@simplywallst.com. This article by Simply Wall St is general in nature. It does not constitute a recommendation to buy or sell any stock, and does not take account of your objectives, or your financial situation. Simply Wall St has no position in the stocks mentioned. Thank you for reading.
