
 Yahoo Finance
 Dow Jones 30 and NASDAQ 100 Forecast for the Week of October 9, 2017, Technical Analysis
Dow Jones 30
The Dow Jones 30 broke out during the week, slicing through the 22,500 level. This is a very bullish sign, and the candle closing towards the top, of course, is very bullish as well. Ultimately, the Dow Jones 30 looks very likely to continue going higher, and I think that the 22,000-level underneath should continue to be a “floor” in this market. I believe pullbacks are valued, as money is flowing into industrials based upon action seen on Wall Street. We have been in a longer-term uptrend, and I think we continue to see plenty of opportunity on pullbacks as value. Longer-term, I believe that we are going to go to the 23,000 level above. I have no interest in shorting, least not right now.
Dow Jones 30 and NASDAQ Index Video 09.10.17
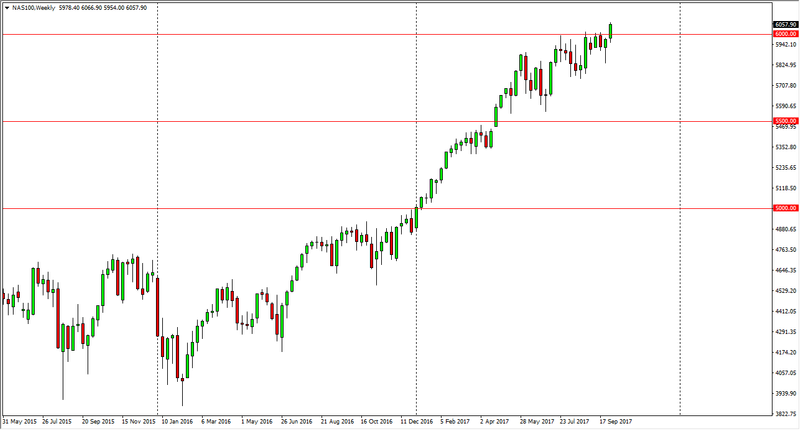
NASDAQ 100
The NASDAQ 100 broke out during the week, slicing through the 6000 level finally. This is an area that has caused quite a bit of resistance in the past, but now that we have broken above there I think the market is free to go much higher. We have been grinding our way to the upside for some time, building up the necessary momentum that was needed. I think the 6000 level should offer support now as it was resistive, and therefore I think that the Wii plenty of buyers looking to get involved on these dips. I suspect that the 5900 level will also offer a floor, so given enough time I think we will continue to reach towards the 6100 level, perhaps even the 6200 level. Remember, the NASDAQ 100 has been very bullish for some time, and I think that we will continue to see the momentum propel the market to the upside.
This article was originally posted on FX Empire
