
 Yahoo Finance
 DPI Holdings Berhad's (KLSE:DPIH) Financials Are Too Obscure To Link With Current Share Price Momentum: What's In Store For the Stock?
Most readers would already be aware that DPI Holdings Berhad's (KLSE:DPIH) stock increased significantly by 22% over the past month. But the company's key financial indicators appear to be differing across the board and that makes us question whether or not the company's current share price momentum can be maintained. Particularly, we will be paying attention to DPI Holdings Berhad's ROE today.
Return on equity or ROE is an important factor to be considered by a shareholder because it tells them how effectively their capital is being reinvested. Simply put, it is used to assess the profitability of a company in relation to its equity capital.
See our latest analysis for DPI Holdings Berhad
How Is ROE Calculated?
Return on equity can be calculated by using the formula:
Return on Equity = Net Profit (from continuing operations) ÷ Shareholders' Equity
So, based on the above formula, the ROE for DPI Holdings Berhad is:
6.3% = RM5.2m ÷ RM82m (Based on the trailing twelve months to August 2022).
The 'return' refers to a company's earnings over the last year. Another way to think of that is that for every MYR1 worth of equity, the company was able to earn MYR0.06 in profit.
What Is The Relationship Between ROE And Earnings Growth?
We have already established that ROE serves as an efficient profit-generating gauge for a company's future earnings. Based on how much of its profits the company chooses to reinvest or "retain", we are then able to evaluate a company's future ability to generate profits. Generally speaking, other things being equal, firms with a high return on equity and profit retention, have a higher growth rate than firms that don’t share these attributes.
A Side By Side comparison of DPI Holdings Berhad's Earnings Growth And 6.3% ROE
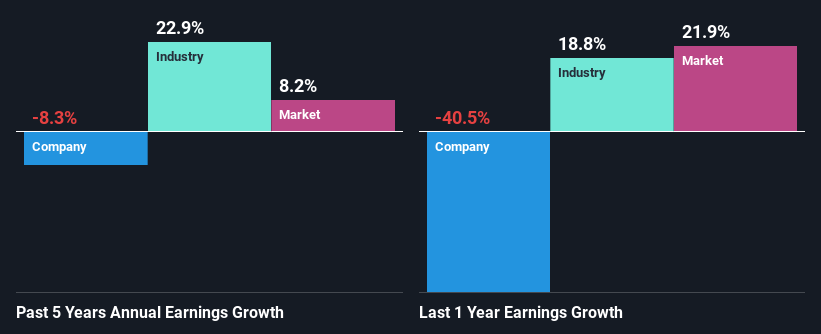
When you first look at it, DPI Holdings Berhad's ROE doesn't look that attractive. Next, when compared to the average industry ROE of 8.6%, the company's ROE leaves us feeling even less enthusiastic. Given the circumstances, the significant decline in net income by 8.3% seen by DPI Holdings Berhad over the last five years is not surprising. We reckon that there could also be other factors at play here. Such as - low earnings retention or poor allocation of capital.
However, when we compared DPI Holdings Berhad's growth with the industry we found that while the company's earnings have been shrinking, the industry has seen an earnings growth of 23% in the same period. This is quite worrisome.
Earnings growth is a huge factor in stock valuation. What investors need to determine next is if the expected earnings growth, or the lack of it, is already built into the share price. Doing so will help them establish if the stock's future looks promising or ominous. One good indicator of expected earnings growth is the P/E ratio which determines the price the market is willing to pay for a stock based on its earnings prospects. So, you may want to check if DPI Holdings Berhad is trading on a high P/E or a low P/E, relative to its industry.
Is DPI Holdings Berhad Making Efficient Use Of Its Profits?
Looking at its three-year median payout ratio of 38% (or a retention ratio of 62%) which is pretty normal, DPI Holdings Berhad's declining earnings is rather baffling as one would expect to see a fair bit of growth when a company is retaining a good portion of its profits. It looks like there might be some other reasons to explain the lack in that respect. For example, the business could be in decline.
Additionally, DPI Holdings Berhad has paid dividends over a period of three years, which means that the company's management is rather focused on keeping up its dividend payments, regardless of the shrinking earnings.
Conclusion
Overall, we have mixed feelings about DPI Holdings Berhad. Even though it appears to be retaining most of its profits, given the low ROE, investors may not be benefitting from all that reinvestment after all. The low earnings growth suggests our theory correct. Wrapping up, we would proceed with caution with this company and one way of doing that would be to look at the risk profile of the business. Our risks dashboard would have the 5 risks we have identified for DPI Holdings Berhad.
Have feedback on this article? Concerned about the content? Get in touch with us directly. Alternatively, email editorial-team (at) simplywallst.com.
This article by Simply Wall St is general in nature. We provide commentary based on historical data and analyst forecasts only using an unbiased methodology and our articles are not intended to be financial advice. It does not constitute a recommendation to buy or sell any stock, and does not take account of your objectives, or your financial situation. We aim to bring you long-term focused analysis driven by fundamental data. Note that our analysis may not factor in the latest price-sensitive company announcements or qualitative material. Simply Wall St has no position in any stocks mentioned.
Join A Paid User Research Session
You’ll receive a US$30 Amazon Gift card for 1 hour of your time while helping us build better investing tools for the individual investors like yourself. Sign up here
