
 Yahoo Finance
 E-mini NASDAQ-100 Index (NQ) Futures Technical Analysis – Strengthens Over 6822.75, Weakens Under 6794.25
December E-mini NASDAQ-100 Index futures closed sharply lower on Tuesday. The biggest decline since the October sell-off was fueled by investors worried about an inverted Treasury market which may be signaling a possible economic slowdown. Lingering concerns about U.S.-China trade relations also added to jitters on Wall Street. Technology stocks fell back into correction territory, led by steep declines in shares of tech heavyweights Apple, Amazon, Alphabet and Facebook.
On Tuesday, December E-mini NASDAQ-100 Index futures settled at 6803.25, down 255.00 or -3.75%.
Daily Swing Chart Technical Analysis
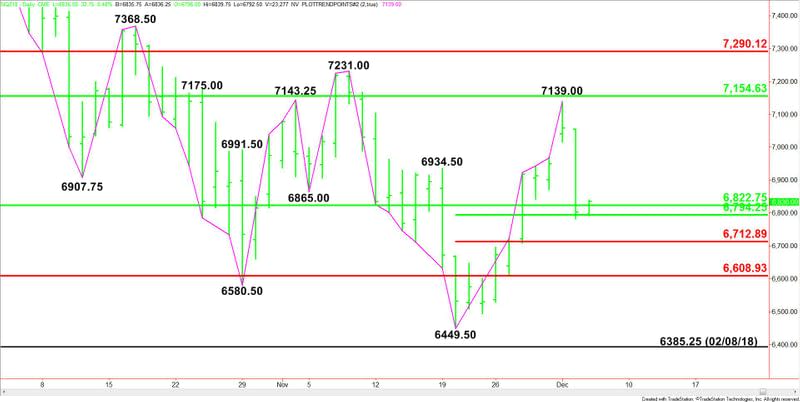
The main trend is down according to the daily swing chart. However, momentum is trending higher. A trade through 7231.00 will change the main trend to up. This could trigger a further rally into 7368.50. A move through 6449.50 will reaffirm the downtrend. This could lead to a test of the February 8 main bottom at 7385.25.
The minor trend is up. This is controlling the upside momentum. A new minor top was formed at 7139.00.
On the downside, the major retracement zone is 6822.75 to 6609.00. Inside this area is a short-term retracement zone at 6794.25 to 6712.75.
On the upside, the major retracement zone is 7154.75 to 7290.25.
Daily Swing Chart Technical Forecast
Based on Tuesday’s close at 2803.25, the direction of the December E-mini NASDAQ-100 Index on Thursday is likely to be determined by trader reaction to the 50% support cluster at 6822.75 to 6794.25.
Bullish Scenario
A sustained move over 6822.75 will indicate the presence of buyers. If this move can generate enough upside momentum then we could possibly see a rally back to 7139.00 and 7154.75.
Bearish Scenario
A sustained move under 6794.25 will signal the presence of sellers. This could trigger an acceleration into the short-term Fibonacci level at 6712.75. If this price level fails then the selling is likely to extend into the major Fibonacci level at 6609.00. This is another trigger point for an acceleration into the main bottom at 6449.50, followed by the February 8 main bottom at 6385.25.
This article was originally posted on FX Empire
