
 Yahoo Finance
 E-mini NASDAQ-100 Index (NQ) Futures Technical Analysis – Potential Upside Target 7821.75 to 7864.50
December E-mini NASDAQ-100 Index futures are edging higher early Monday on the back of better-than-expected Chinese factory activity report for September.
The Caixin/Markit factory Purchasing Managers’ Index (PMI) came in at 51.4 for September, above expectations of 50.2 by analysts in a Reuters poll. The official Chinese manufacturing PMI for September was also above expectations, but still showed a contraction at 49.8 in September, higher than expectations of 49.5 by analysts in a Reuters poll. That compared against an official PMI reading of 49.5 in August.
At 04:38 GMT, December E-mini NASDAQ-100 Index futures are trading 7731.75, up 30.50 or +0.40%.
Gains are likely being capped by reports the White House is considering curbs on U.S. investments in China, according to a CNBC source.
Daily Swing Chart Technical Analysis
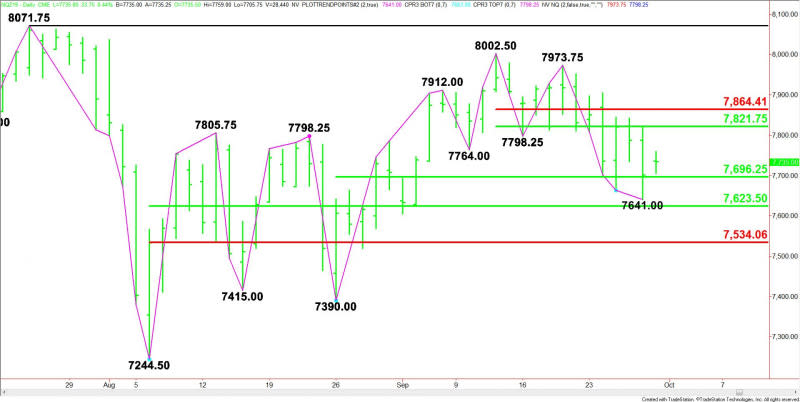
The main trend is down according to the daily swing chart. A trade through 7641.00 will signal a resumption of the downtrend. The main trend will change to up on a move through 7973.75.
The main range is 7244.50 to 8002.50. Its retracement zone at 7623.50 to 7534.00 is controlling the near-term direction of the index.
The intermediate range is 7390.00 to 8002.50. Its retracement zone at 7696.25 to 7624.00 helped stop the selling pressure at 7641.00 on Friday.
The short-term range is 8002.50 to 7641.00. Its retracement zone at 7821.75 to 7864.50 is the primary upside target. Since the main trend is down, sellers are likely to come in on a test of this area. They are going to try to form a secondary lower top.
Daily Swing Chart Technical Forecast
Based on the early price action and the current price at 7731.75, the direction of the December E-mini NASDAQ-100 Index on Monday is likely to be determined by trader reaction to the 50% level at 7696.25.
Bullish Scenario
A sustained move over 7696.25 will indicate the presence of buyers. If this move creates enough upside momentum then look for the rally to possibly extend into 7821.75 to 7864.50.
Bearish Scenario
A sustained move under 7696.25 will signal the presence of sellers. This could trigger a break into 7641.00, followed closely by the main 50% level at 7623.50. This is a potential trigger point for an acceleration to the downside with the main Fibonacci level at 7534.00, the next likely downside target.
This article was originally posted on FX Empire
More From FXEMPIRE:
Crude Oil Price Update -Testing Retracement Zone; Weakens Under $55.60, Strengthens Over $57.19
Natural Gas Price Fundamental Weekly Forecast – Rising Production Could Weigh on Prices
AUD/USD and NZD/USD Fundamental Daily Forecast – Weak Business Confidence Report Sinks Kiwi
Bitcoin Cash – ABC, Litecoin and Ripple Daily Analysis – 30/09/19
