E-mini NASDAQ-100 Index (NQ) Futures Technical Analysis – Needs Follow-Through Rally to Confirm Uptrend
March E-mini NASDAQ-100 Index futures closed higher on Tuesday as U.S. Treasury Secretary Janet Yellen advocated for a hefty fiscal relief package before lawmakers to help the world’s largest economy ride out a pandemic-driven slump.
On Tuesday, March E-mini NASDAQ-100 Index futures settled at 12985.50, up 183.25 or +1.41%.
In other news, Netflix shares rose more than 11% following the closing bell on Tuesday after the streaming television provider reported paid subscriber additions for the fourth quarter topped Wall Street expectations.

Daily Swing Chart Technical Analysis
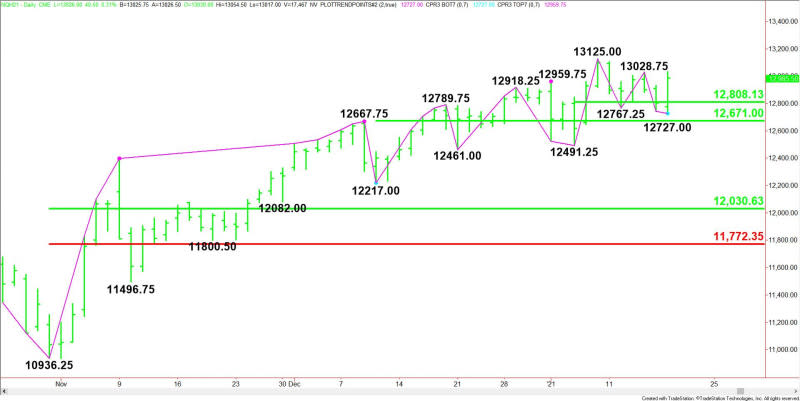
The main trend is up according to the daily swing chart. The trend turned back up when buyers took out the previous main top at 13028.75 late in the session. The new main bottom is 12727.00. A trade through this level will change the trend to down.
The minor range is 12491.25 to 13125.00. Its 50% level at 12808.00 is new support.
The short-term range is 12217.00 to 13125.00. Its 50% level at 12671.00 is additional support.
The main range is 10936.25 to 13125.00. Its retracement zone at 12030.50 to 11772.25 is the major support area controlling the near-term direction of the index.
Short-Term Outlook
With two changes in trend in as many sessions, conditions are very choppy, but this is the daily chart, so you have to expect two sided price action before the next major move. Professionals have to shake the trees a little to rattle the weaker traders.
Now that the trend has turned back up, the follow-through move becomes the key as to whether the change in trend was fueled by buy stops or aggressive new buyers.
The longer the index spends under the record high at 13125.00 set on January 8, the more the chart pattern will look distributive, which tends to indicate lower prices are coming.
The real key to the next move is whether the next catalyst encourages investors to chase the market higher and buy strength, or pushes them to look for value at much lower levels. It comes down to determining how much bang for the buck can they get buying a new contract higher versus buying a near-term correction into support.
For a look at all of today’s economic events, check out our economic calendar.
This article was originally posted on FX Empire

 Yahoo Finance