
 Yahoo Finance
 E-mini NASDAQ-100 Index (NQ) Futures Technical Analysis Forecast – Downside Momentum Targets 12070.75
December E-mini NASDAQ-100 Index futures are edging lower early Monday mostly on end of the month profit-taking and position-squaring. Nonetheless, the tech-weighted index is still in a position to post its biggest monthly advance since April.
At 07:30 GMT, December E-mini NASDAQ-100 Index futures are trading 12218.75, down 38.75 or -0.32%.
The index took a hit shortly after the futures market opening after Reuters reported that the Trump administration is weighing blacklisting Chinese leading chipmaker SMIC as well as national offshore oil and gas producer CNOOC. The move would limit their access to American investors and escalate tensions with China before President-elect Joe Biden takes over.
Daily Swing Chart Technical Analysis
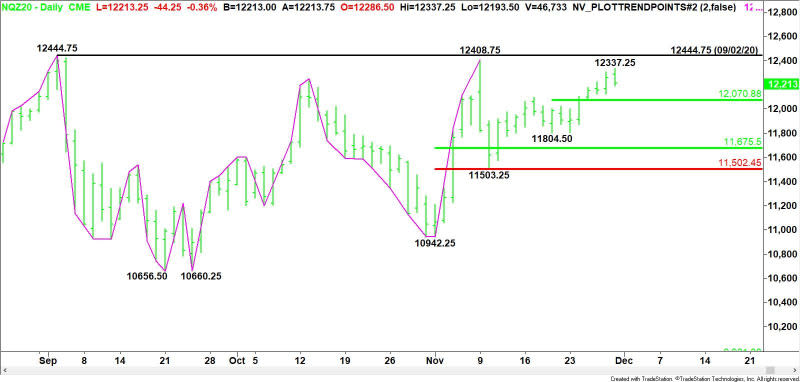
The main trend is up according to the daily swing chart. A trade through 12408.75 will signal a resumption of the uptrend while a move through 12444.75 will reaffirm the uptrend. A trade through 10942.25 will change the main trend to down.
The minor trend is also up. A trade through 11804.50 will change the minor trend to down. This will also shift momentum to the downside.
The minor range is 11804.50 to 12337.25. Its 50% level at 12070.75 is the first downside target.
The main range is 10942.25 to 12408.75. Its retracement zone at 11675.50 to 11502.50 is another potential support zone.
Daily Swing Chart Technical Forecast
If the upside momentum resumes then look for buyers to attempt to grind through resistance at 12337.25, 12408.75 and 12444.75. The latter is a potential trigger point for an acceleration to the upside.
If the intraday downside momentum continues, then look for the pullback to extend into the minor pivot at 12070.75. Since the main trend is up, buyers are likely to show up on the first test of this level.
Taking out 12070.75 could trigger an acceleration to the downside with the next potential targets coming in at 11804.50 and 11675.50.
The best support area and value zone is 11675.50 to 11502.50. A test of this zone is likely to attract the strongest buying.
For a look at all of today’s economic events, check out our economic calendar.
This article was originally posted on FX Empire
More From FXEMPIRE:
GBP/USD Daily Forecast – British Pound Starts The Week On A Strong Note
US Dollar Index (DX) Futures Technical Analysis Forecast – Next Major Downside Target 90.810
Crude Oil Price Update – OPEC Decision Could Drive Prices to $46.43 or $42.57
S&P Global in Advanced Talks to Acquire London-based IHS Markit for $44 Billion
