
 Yahoo Finance
 E-mini NASDAQ-100 Index (NQ) Futures Technical Analysis – August 5, 2019
September E-mini NASDAQ-100 Index futures are trading sharply lower during the pre-market session on Monday. The selling pressure is being fueled by investor aversion to risk. This was triggered late last week when President Trump’s announcement of additional tariffs led to an escalation of trade tensions between the United States and China. Investors are shedding risky assets because they believe the new tariffs will further weaken the global economy and the down turn will spread eventually to the United States.
At 11:27 GMT, September E-mini NASDAQ-100 Index futures are trading 7570.00, down 132.25 or -1.72%.
Daily Technical Analysis
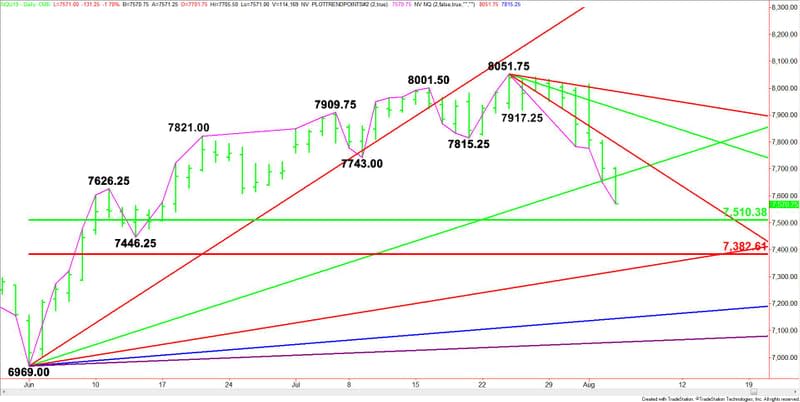
The main trend is down according to the daily swing chart. The next downside target is the swing bottom at 7446.25. This is the last main bottom support before the June 3 bottom at 6969.00. On the upside, the old bottoms at 7743.00, 7815.25 and 7917.25 are potential resistance levels. The main trend will change to up on a trade through 8051.75.
The main range is 6969.00 to 8051.75. Its retracement zone at 7510.25 to 7382.50 is the primary downside target. This zone is controlling the longer-term direction of the index. Watch for a technical bounce on the first test of this zone.
Daily Technical Forecast
Based on the early price action and the current price at 7570.00, the direction of the September E-mini NASDAQ-100 Index is being controlled today by the uptrending Gann angle at 7673.00.
Bearish Scenario
A sustained move under 7630.00 will indicate the presence of sellers. If the downside momentum continues then look for the selling to continue into the main 50% level at 7510.25. Watch for buyers on the first test of this level.
If 7510.25 fails as support then look for the selling to possibly extend into the main Fibonacci level at 7382.50, followed closely an uptrending Gann angle at 7321.00. This is another trigger point for an acceleration to the downside.
Bullish Scenario
Overtaking and sustaining a rally over 7630.00 will signal the presence of buyers. If this move is able to generate enough upside momentum then look for a rally into the downtrending Gann angle at 7795.75.
Overview
Watch the price action and read the order flow on a test of 7510.25 to 7382.50. Buyers may come in on a test of this zone because it represents value. Also, the index is down eight sessions from its last main top, which puts it inside the window of time for a closing price reversal bottom.
This article was originally posted on FX Empire
