
 Yahoo Finance
 E-mini NASDAQ-100 Index (NQ) Futures Technical Analysis – Strengthens Over 12622.25, Weakens Under 12121.00
June E-mini NASDAQ-100 Index futures are trading lower during the pre-market session on Monday, after oil prices slid and riskier currencies took a hit during the Asian and European sessions as unexpectedly weak economic data from China highlighted fears about a slowdown in growth.
At 09:11 GMT, June E-mini NASDAQ-100 Index futures are trading 12341.00, down 41.75 or -0.34%. On Friday, the Invesco QQQ Trust ETF (QQQ) settled at $301.89, up $10.74 or +3.69%.
China’s April retail sales plunged 11.1% on the year, almost twice the fall forecast, as full or partial COVID-19 lockdowns were imposed in dozens of cities. Industrial output dropped 2.9% when analysts had looked for a slight increase.
NASDAQ component earnings highlights this week include Take-Two Interactive Software on Monday, Cisco Systems and Analog Devices on Wednesday, and Applied Materials on Thursday.
Daily Swing Chart Technical Analysis
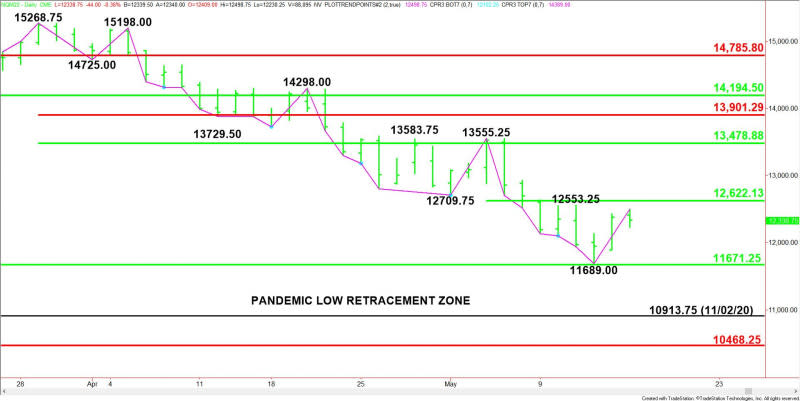
The main trend is down according to the daily swing chart. A trade through 11689.00 will signal a resumption of the downtrend. A move through 13555.25 will change the main trend to up.
The minor trend is also down. A trade through 12553.25 will change the minor trend to up. This will also shift momentum to the upside.
The major support is a long-term 50% level at 11671.25. This is followed by a long-term Fibonacci level at 10468.25.
The first minor range is 12553.25 to 11689.00. The index is currently trading on the strong side of its pivot at 12121.00, making it support.
The second minor range is 13555.25 to 11689.00. Its pivot at 12622.25 is the next upside target and potential resistance.
Daily Swing Chart Technical Forecast
The early price action suggests the direction of the June E-mini NASDAQ-100 futures contract on Monday is likely to be determined by trader reaction to 12121.00.
Bullish Scenario
A sustained move over 12121.25 will indicate the presence of counter-trend buyers.
If this move creates enough upside momentum then look for a surge into the minor top at 12553.25, followed by the second pivot at 12622.25.
Sellers could come in on the first test of this level, but overtaking it with conviction could trigger an acceleration to the upside.
Bearish Scenario
A sustained move under 12121.00 will signal the return of sellers.
If this generates enough downside momentum then look for the selling to possibly extend into the main bottom at 11689.00, followed by the major 50% level at 11671.25.
The latter is a potential trigger point for an acceleration to the downside with the November 2, 2020 main bottom at 10913.75 the next major target.
For a look at all of today’s economic events, check out our economic calendar.
This article was originally posted on FX Empire
