
 Yahoo Finance
 E-mini NASDAQ-100 Index (NQ) Futures Technical Analysis – Strengthens Over 8347.75, Weakens Under 8313.50
December E-mini NASDAQ-100 Index futures are trading higher on Friday shortly before the release of the U.S. Non-Farm Payrolls report at 13:30 GMT and the cash market opening at 14:30 GMT. After a steep two-day sell-off earlier in the week, the index has clawed back about 62% of its losses. This puts it at a critical point on the daily chart where buyers are going to come in a drive the market toward all-time highs, or sellers are going to emerge in an effort to form a secondary lower top.
At 10:32 GMT, December E-mini NASDAQ-100 Index futures are trading 8336.25, up 27.00 or +0.32%.
All eyes will be on the NFP report early in the day, but the primary focus will be on whether the U.S. and China are making enough progress to complete a partial trade deal before new tariffs against China kick in on December 15.
Daily Swing Chart Technical Analysis
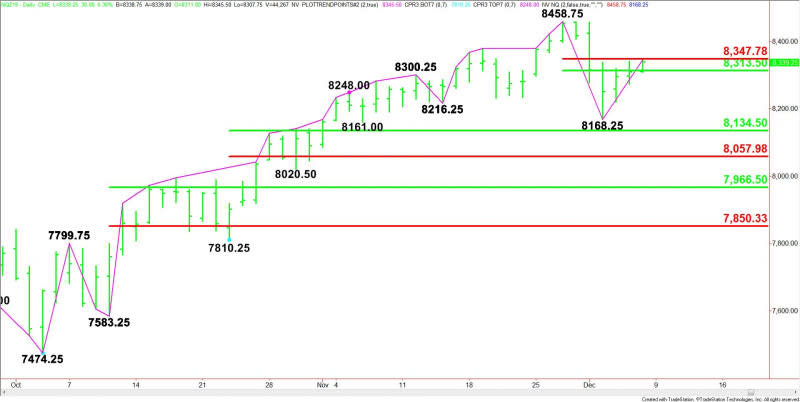
The main trend is down according to the daily swing chart. The trend turned down on Tuesday. A trade through 8168.25 will signal a resumption of the downtrend. The main trend will change to up on a trade through 8458.75.
The short-term range is 8458.75 to 8168.25. Its retracement zone at 8313.50 to 8347.75 is currently being tested. Trader reaction to this zone will determine the near-term direction of the index.
Look for an upside bias to develop on a sustained move over 8347.75, and for the downside bias to resume on a sustained move under 8313.50.
The next retracement zone at 8134.50 to 8058.00 is potential support.
The major retracement zone support comes in at 7966.50 to 7850.25.
Daily Swing Chart Technical Forecast
Based on the early price action, the direction of the December E-mini NASDAQ-100 Index on Friday is likely to be determined by trader reaction to the short-term Fibonacci level at 8347.75.
Bullish Scenario
A sustained move over 8347.75 will indicate the presence of buyers. This could trigger an acceleration to the upside with 8458.75 the next major upside target.
Bearish Scenario
A sustained move under 8347.75 will signal that sellers are stopping the rally. The first downside target is the 50% level at 8313.50. Holding this level will create a neutral trade.
Taking out 8313.50 could trigger an acceleration to the downside with 8258.00 the first downside target, followed by the main bottom at 8168.25.
This article was originally posted on FX Empire
