
 Yahoo Finance
 E-mini NASDAQ-100 Index (NQ) Futures Technical Analysis – Weakens Under 10708.50, Strengthens Over 10791.25
September E-mini NASDAQ-100 Index futures are trading slightly better shortly before the cash market opening after reversing earlier losses. Futures edged lower early in the session as concerns about a jump in COVID-19 cases kept risk appetite in check. The market recovered on expectations of more fiscal stimulus measures from the United States and Europe.
At 11:32 GMT, September E-mini NASDAQ-100 index are trading 10647.25, up 24.75 or +0.23%.
This week, major components of the index including Microsoft Corp, Amazon.com Inc, Tesla Inc and Intel Corp are expected to report quarterly earnings.
After leading the U.S. stocks’ rally since March 23, the tech-heavy NASDAQ eased slightly last week as investors turned toward cyclical sectors on prospects of a faster-than-expected recovery.
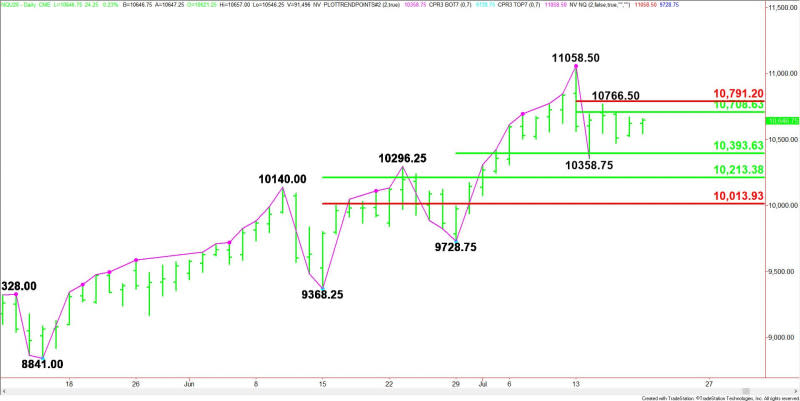
Daily Swing Chart Technical Analysis
The main trend is up according to the daily swing chart, however, momentum has been trending lower since the formation of the closing price reversal top on July 13.
A trade through 11058.50 will negate the closing price reversal top and signal a resumption of the uptrend.
A move through 10358.75 will indicate the selling pressure is getting stronger. The main trend will change to down on a trade through the nearest swing bottom at 9728.75.
The minor range is 11058.50 to 10358.75. Its retracement zone at 10708.75 to 10791.25 is potential resistance. This zone stopped the rally at 10766.50 last week.
Aggressive counter-trend sellers are trying to establish a potentially bearish secondary lower top inside this zone.
The first short-term range is 9728.75 to 11058.50. Its 50% level at 10393.50 is the first potential support level.
The next short-term range is 9368.25 to 11058.50. Its retracement zone at 10213.25 to 10014.00 is the next potential support zone.
Daily Swing Chart Technical Forecast
The near-term direction is likely to be determined by trader reaction to 10708.75 to 10791.25.
Look for a bullish tone to develop on a sustained move over 10791.25 and for the bearish tone to continue on a sustained move under 10708.50.
On the downside, the first target is a potential support cluster at 10393.50 to 10358.75. Since the main trend is up, buyers are likely to come in on a test of this zone.
If investors are looking for value then the index may be pressed as low as 10213.25 to 10014.00.
For a look at all of today’s economic events, check out our economic calendar.
This article was originally posted on FX Empire
More From FXEMPIRE:
E-mini S&P 500 Index (ES) Futures Technical Analysis – Lackluster Start to the Week
GBP/JPY Price Forecast – British Pound Continues to Press Japanese Yen
GBP/USD Price Forecast – British Pound Slams into Familiar Resistance
AstraZeneca’s COVID-19 Vaccine Shows Positive Immune Response; Target Price GBX 10,970
EUR/USD Price Forecast – Euro Is Still Sluggish but Positive
