
 Yahoo Finance
 E-mini NASDAQ-100 Index (NQ) Futures Technical Analysis – April 13, 2018 Forecast
Increased demand for higher risk assets due to a softening of tensions over Syria and a bullish start to earnings season is helping to drive the June E-mini NASDAQ-100 Index higher shortly before the cash market opening.
Daily Swing Chart Technical Analysis
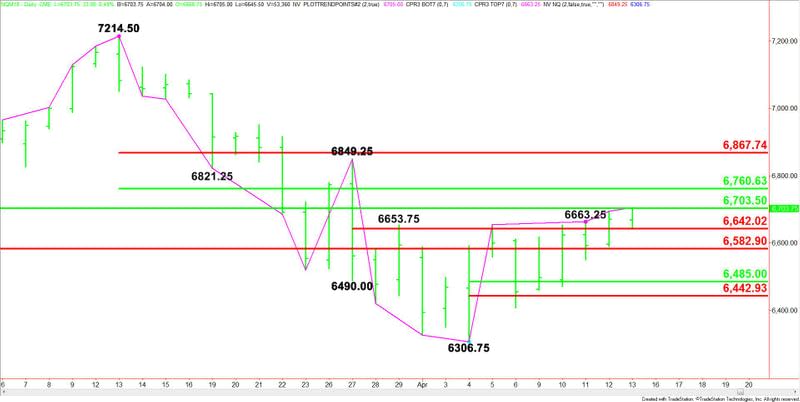
The main trend is down according to the daily swing chart, however, momentum has been trending higher since the formation of the closing price reversal bottom at 6306.75 on April 4.
The main trend will change to up on a move through 6849.25.
Retracement levels will be a factor in determining the near-term direction of the index today.
On the upside, the first resistance is a 50% level at 6703.50. This is followed by another 50% level at 6760.75. This level is a potential trigger point for an acceleration to the upside.
On the downside, the first support is 6642.00, followed by 6583.00. The latter is a potential trigger point for an acceleration into 6485.00 to 6443.00.
Daily Swing Chart Technical Forecast
Based on the current price at 6705.75 and the earlier price action, the direction of the June E-mini NASDAQ-100 Index the rest of the session will be determined by trader reaction to the 50% level at 6703.50.
A sustained move over 6703.50 will indicate the presence of buyers. This could trigger a fast rally into another 50% level at 6760.75.
The 50% level at 6760.75 is the trigger point for an acceleration to the upside with a main top at 6849.25 and a Fibonacci level at 6867.75 the next likely upside targets.
A sustained move under 6703.50 will signal the presence of sellers. This could fuel a retest of 6642.00, followed by 6583.00.
The trigger point for an acceleration to the downside is 6583.00. If the selling pressure increases under this levels then look for the selling to extend into the short-term retracement zone at 6485.00 to 6443.00.
This article was originally posted on FX Empire
