
 Yahoo Finance
 E-mini NASDAQ-100 Index (NQ) Futures Technical Analysis – August 21, 2018 Forecast
September E-mini NASDAQ-100 Index futures are trading higher shortly after the cash market opening. The move is being fueled by increased demand for risky assets.
Daily Technical Analysis
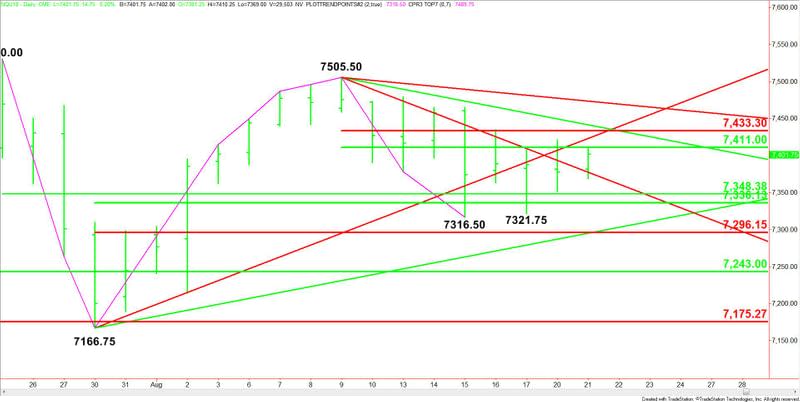
The main trend is down according to the daily swing chart. A trade through 7505.50 will change the main trend to up. A move through 7316.50 will signal a resumption of the downtrend. The index has been drifting sideways-to-lower since late July, following a weaker-than-expected earnings report from Facebook. In the meantime, money has been flowing into the Dow and the S&P 500 Index.
The main range is 7166.75 to 7505.50. Its retracement zone at 7330.00 to 7296.00 is support. Additional support is a longer-term 50% level at 7348.25.
The short-term range is 7505.50 to 7316.50. Its retracement zone at 7411.00 to 7433.25 is acting like resistance.
The index has been trading in between the retracement zones for about a week. This indicates investor indecision and impending volatility.
Daily Technical Forecast
Based on the early price action, a bullish tone could develop on a sustained move over 7411.00 and a bearish tone could develop on a sustained move under a downtrending Gann angle at 7377.50.
A move over 7411.00 will indicate the buying is getting stronger. This could trigger a labored rally with targets at 7422.75, 7433.25 and 7441.50.
The trigger point for an acceleration to the upside is 7441.50. Taking out this angle could fuel a move into another downtrending Gann angle at 7473.50. This is the last potential resistance angle before the 7505.50 main top.
The inability to overcome and sustain a move over 7411.00 will signal the presence of sellers. This could trigger a break into 7377.50. This level held as support earlier in the session.
If 7377.50 fails as support then look for the selling to extend into 7348.25 and 7336.00.
This article was originally posted on FX Empire
More From FXEMPIRE:
Natural Gas Price Fundamental Daily Forecast – Bullish Weather Patterns Attracts New Buyers
DAX Index Price Forecast – German DAX to Continue Positive Movement as Global Trade Tensions Ease
Technical Checks For EUR/USD, USD/JPY, AUD/USD & USD/CHF: 21.08.2018
Crude Oil Price Update – Reaction to Retracement Zone at $65.81 to $66.26 Will Set This Week’s Tone
Gold Hits 1-Week High as Trump’s Comment Drags down US Greenback
