
 Yahoo Finance
 E-mini NASDAQ-100 Index (NQ) Futures Technical Analysis – December 06, 2017 Forecast
December E-mini NASDAQ-100 Index futures are trading lower shortly after the opening. The index is the weakest of the three majors and is currently in a position to challenge a major retracement zone.
Daily Technical Analysis
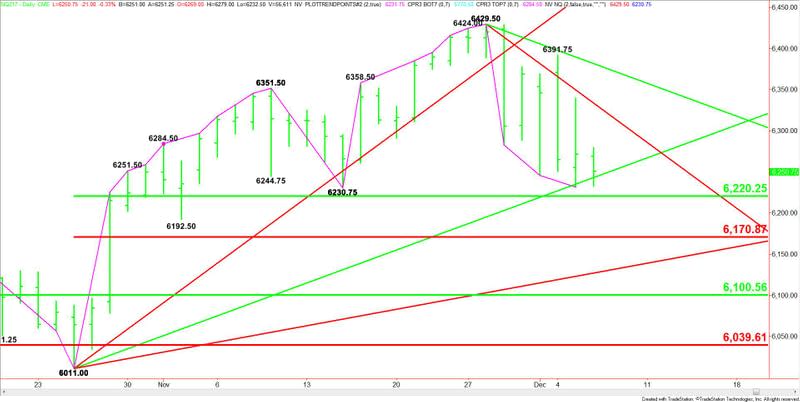
The main trend is up according to the daily swing chart. However, momentum has been trending lower since November 28. A trade through 6230.75 will change the main trend to down.
The main range is 6011.00 to 6429.50. Its retracement zone at 6220.25 to 6170.75 is the primary downside target. Since this is a value area, aggressive counter-trend buyers could show up on a test of this zone. This could trigger a counter-trend short-covering rally.
Daily Technical Forecast
Based on the early trade, the direction of the index is likely to be determined by trader reaction to the uptrending Gann angle at 6243.00.
A sustained move under 6243.00 will signal the presence of sellers. This could trigger a quick break into the main bottom at 6230.75 and the main 50% level at 6220.25.
The trigger point for an acceleration to the downside is 6220.25. If this price fails as support and the selling volume increases on the move then look for a possible break into the main Fibonacci level at 6170.75.
A sustained move over 6243.00 will indicate the presence of buyers. If enough buying volume comes in to support the move, we could see a rally into the next downtrending Gann angle at 6333.50.
Watch the price action and read the order flow at 6243.00 all session. Trader reaction to this angle will tell us if the buyers or sellers are in control today.
This article was originally posted on FX Empire
