
 Yahoo Finance
 E-mini NASDAQ-100 Index (NQ) Futures Technical Analysis – February 12, 2018 Forecast
March E-mini NASDAQ-100 Index futures are called higher based on the pre-market trade. Traders are currently testing a short-term retracement zone. This zone should determine the direction of the market today.
Daily Technical Analysis
The main trend is down according to the daily swing chart, but the price action earlier in the session confirmed Friday’s closing price reversal bottom, signaling a possible shift in momentum to the upside.
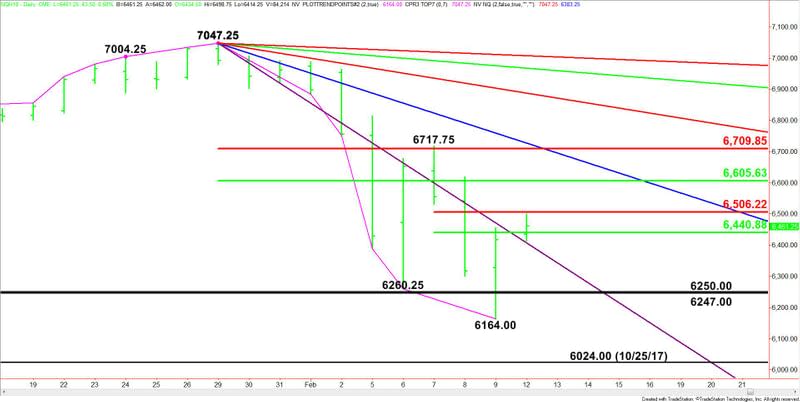
A trade through 6164.00 will negate the closing price reversal bottom and signal a resumption of the downtrend. This could trigger a further decline into 6024.00.
A trade through 6717.75 will change the minor trend to up.
The short-term range is 6717.75 to 6164.00. Its retracement zone at 6440.75 to 6506.25 is currently being tested.
The main range is 7047.25 to 6164.00. Its retracement zone at 6605.75 to 6710.00 is the primary upside target.
Daily Technical Forecast
Based on the early price action, look for a bullish tone to develop on a sustained move over 6506.25 and for a downside bias on a sustained move under 6440.75.
Taking out 6506.25 will indicate the presence of buyers. This could trigger a move into 6605.75, followed by 6710.00.
If sellers hold the index under 6440.75 then look for a move into a downtrending Gann angle at 6407.25. A sustained move under 6407.25 will indicate the selling is getting stronger. This could trigger an acceleration into former bottoms at 6250.00, 6247.00 and Friday’s low at 6164.00.
This article was originally posted on FX Empire
More From FXEMPIRE:
The Ultimate Guide to Buy Ethereum (ETH); All You Need to Know
E-mini NASDAQ-100 Index (NQ) Futures Technical Analysis – February 12, 2018 Forecast
E-mini Dow Jones Industrial Average (YM) Futures Analysis – February 12, 2018 Forecast
Price of Gold Fundamental Daily Forecast – Weaker Dollar Biggest Influence on Gold Today
