
 Yahoo Finance
 E-mini NASDAQ-100 Index (NQ) Futures Technical Analysis – February 20, 2018 Forecast
March E-mini NASDAQ-100 Index futures are trading lower shortly after the cash market opening. Stocks are down across the board, indicating a shift in investor sentiment. Concerns over inflation, rising Treasury yields and position-squaring ahead of Wednesday’s Fed minutes are behind the price action.
Daily Technical Analysis
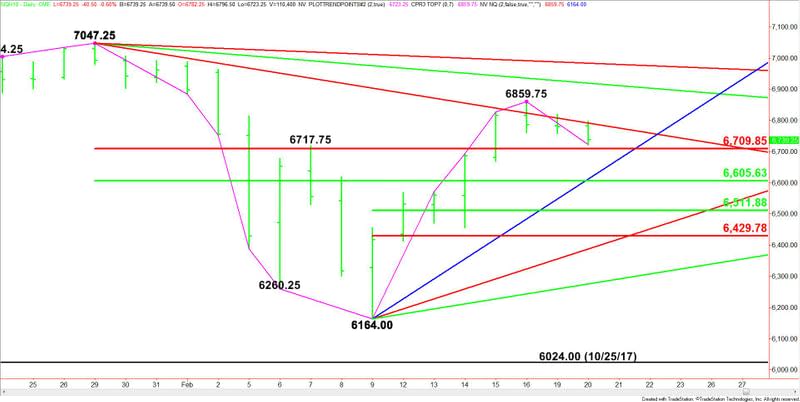
The main trend is down according to the daily swing chart. A trade through 6859.75 will change the main trend to up. The next main top is 7047.25.
Momentum is mixed. The recent short-covering rally which drove the index into 6709.75, changed momentum to up. However, Friday’s closing price reversal top suggests momentum may be getting ready to shift back to the downside.
The main range is 7047.25 to 6164.00. Its retracement zone at 6605.50 to 6710.00 is controlling the direction of the index. Holding above this zone will give the market an upside bias.
The short-term range is 6164.00 to 6859.75. If the selling pressure continues then its retracement zone at 6511.75 to 6429.75 will become the primary downside target.
Daily Technical Forecast
Based on the early price action, the direction of the index today is likely to be determined by trader reaction to the downtrending Gann angle at 6791.25.
A sustained move under 6791.25 will indicate the presence of sellers. This could drive the index into the main Fibonacci level at 6710.00.
Taking out 6710.00 could drive the index into a support cluster at 6612.00 to 6605.50. Look for a technical bounce on the first test of this area. If it fails then look for a possible acceleration into 6511.75 to 6429.75.
A sustained move over 6791.25 will signal the presence of buyers. This is a potential trigger point for an acceleration to the upside with potential targets at 6859.75, 6919.25 and 6983.25. The latter is the last potential resistance angle before the 7047.25 main top.
This article was originally posted on FX Empire
More From FXEMPIRE:
AUD/USD Forex Technical Analysis – In Position to Test Short-Term Retracement Zone at .7873 to .7846
Wall Street Ready after Long Holiday Weekend, US Futures Lower
Oil Price Fundamental Daily Forecast – Pressured by Stronger Dollar, Weaker Stocks
E-mini Dow Jones Industrial Average (YM) Futures Analysis – February 20, 2018 Forecast
E-mini NASDAQ-100 Index (NQ) Futures Technical Analysis – February 20, 2018 Forecast
