
 Yahoo Finance
 E-mini NASDAQ-100 Index (NQ) Futures Technical Analysis – February 11, 2019 Forecast
March E-mini NASDAQ-100 Index futures are trading higher shortly after the opening, but giving back some of its earlier gains. The early rally was fueled by optimism over U.S.-China trade negotiations that are expected to begin later this week. Investors are hoping the two economic powerhouses will strike a deal to end the ongoing trade dispute. Pessimism over another possible government shutdown may have stopped the rally, while dueling an intraday sell-off.
At 15:07 GMT, March E-mini NASDAQ-100 Index futures are trading 6929.75, up 9.00 or +0.13%.
Daily Swing Chart Technical Analysis
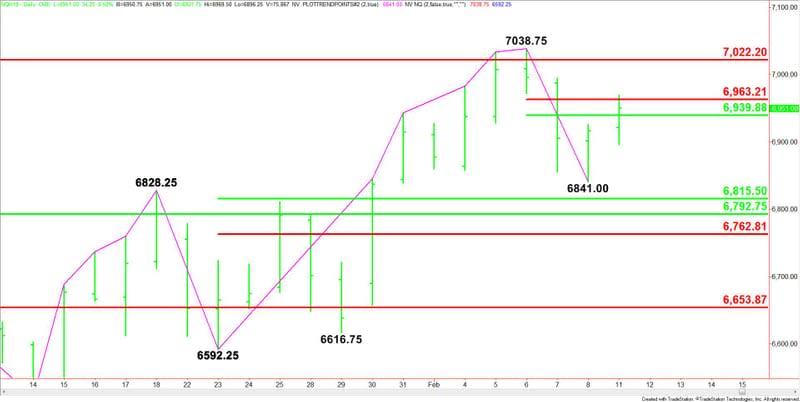
The main trend is up according to the daily swing chart. However, momentum has been trending lower since the formation of the closing price reversal top at 7038.75 on February 6. A trade through this top will negate the closing price reversal top and signal a resumption of the uptrend.
The minor trend is also up. A new minor bottom was formed at 6841.00. A trade through this level will change the minor trend to down. This will reaffirm the shift in momentum.
The short-term range is 7038.75 to 6841.00. Its retracement zone at 6939.75 to 6963.25 is the first upside target. Trader reaction to this zone will determine if the market moves higher, or if a secondary lower top forms.
The main range is 6592.25 to 7038.75. Its retracement zone at 6815.50 to 6762.75 is the nearest downside target.
The major retracement zone is 6792.75 to 6653.75. Inside this zone is the main 50% level at 6792.75.
Daily Swing Chart Technical Forecast
Based on the early price action, the direction of the March E-mini NASDAQ-100 Index the rest of the session is likely to be determined by trader reaction to 6939.75 and 6963.25.
Bullish Scenario
Holding above 6939.75 will indicate the presence of buyers, but overtaking 6925.00 will likely trigger an acceleration to the upside with the next major targets coming in at 7022.5 and 7038.75.
Bearish Scenario
A sustained move under 6938.75 will signal the presence of sellers. If this move creates enough downside momentum then look for a potential break into the minor bottom at 6841.00. If the selling is strong enough to take out this minor bottom then look for the move to extend into a series of retracement levels at 6815.50, 6792.75 and 6762.75. Buyers are likely to come in on a test of these levels, dampening the selling pressure.
This article was originally posted on FX Empire
More From FXEMPIRE:
GBP/USD Price Forecast – British pound falls to kick off week
E-mini NASDAQ-100 Index (NQ) Futures Technical Analysis – February 11, 2019 Forecast
GBP/JPY Price Forecast – British pound continues to tread water
Gold Price Prediction – Gold Slips as the Dollar Continues to Gain Traction
USD/CAD Daily Price Forecast – USD/CAD Range Bound Near 1.33 Handle
