
 Yahoo Finance
 E-mini NASDAQ-100 Index (NQ) Futures Technical Analysis – Up, Up and Away; Top-Pickers Feeding the Bull
September E-mini NASDAQ-100 Index futures are soaring to a record high at the mid-session on Monday as data showing unexpected growth in the U.S. services sector last month and optimism over China’s revival helped investors look past a spike in new cases of COVID-19 at home.
The ISM’s non-manufacturing activity index jumped to 57.1 in June, almost returning to pre-pandemic levels, but a recent surge in COVID-19 cases in the United States has threatened the emergency recovery, according to Reuters.
At 15:56 GMT, September E-mini NASDAQ-100 Index futures are trading 10609.00, up 253.25 or 2.45%.
During Asian hours, Chinese stocks surged 5% on ample liquidity, cheap funding and expectations of a faster and a better bounce-back in business activity than other major countries that are still battling the coronavirus crisis.
Among the individual shares, Tesla Inc surged 7.4%, building on a four-day rally, after JPMorgan bumped up its price target for the electric carmaker’s stock following its better-than-expected quarterly deliveries.
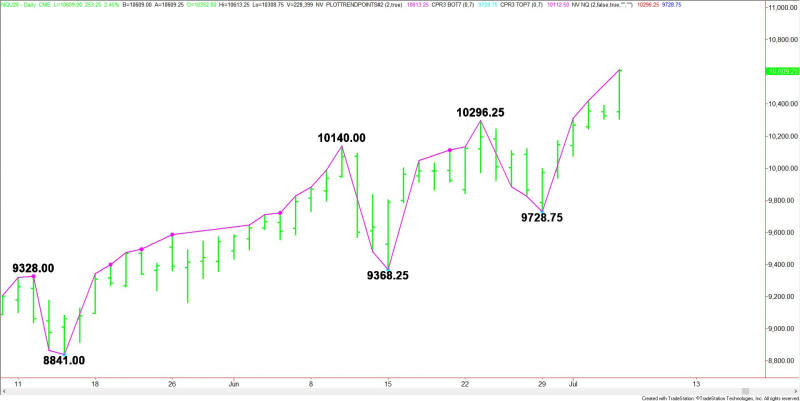
Daily Swing Chart Technical Analysis
The main trend is up according to the daily swing chart. This was confirmed early in the session on Monday when buyers took out Thursday’s high at 10422.25. The main trend will change to down on a move through the last main bottom at 9728.75.
Daily Swing Chart Technical Forecast
We’re at all-time highs so there is no resistance so don’t try to pick a top, you’re just feeding the bull anyway.
If you feel the need to short the market or if you’re looking for an excuse to book profits, then wait for a closing price reversal top and sell the confirmation. But you’re going to have to wait a long time today for this chart pattern because it won’t form unless there is a close under 10355.75.
For a look at all of today’s economic events, check out our economic calendar.
This article was originally posted on FX Empire
