
 Yahoo Finance
 E-mini NASDAQ-100 Index (NQ) Futures Technical Analysis – Growth Stocks Pressured Amid Treasury Yield Surge
September E-mini NASDAQ-100 Index futures are edging lower shortly after the mid-session on Monday. The move erased all of the market’s previous intraday gains. It also kept the market on pace to finish with its worst first half loss in 50 years.
At 17:43 GMT, September E-mini NASDAQ-100 Index futures are trading 12046.75, down 93.75 or -0.77%. The Invesco QQQ Trust ETF (QQQ) is at $292.48, down $2.13 or -0.72%.
In stock related news, technology shares were big losers as the 10-year U.S. Treasury yield crept higher. Gaming names Electronic Arts and Take-Two Interactive were down 3.5% and 3.3%, respectively.
In economic news, pending home sales posted a surprise 0.7% increase in May from April, the National Association of Realtors reported Monday, likely due to a brief pullback in mortgage rates. That beat expectations of a 4% drop.
Quarterly rebalancing may have also contributed to the selling pressure.
Daily Swing Chart Technical Analysis
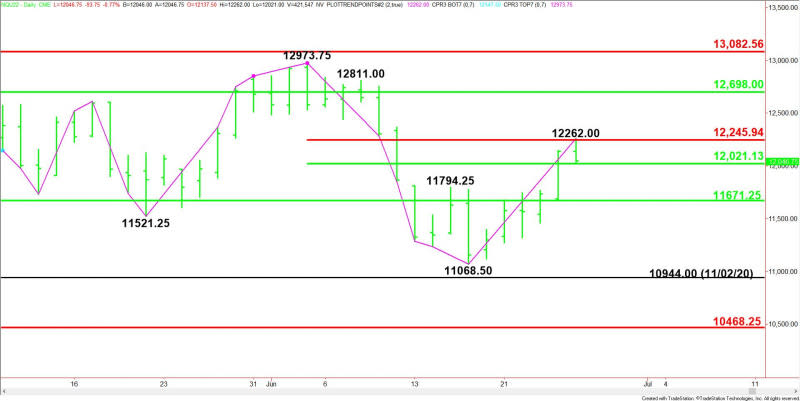
The main trend is down according to the daily swing chart. However, momentum is trending higher.
A trade through 12973.75 will change the main trend to up. A move through 11068.50 will signal a resumption of the downtrend.
The minor trend is also up. This is controlling the momentum.
The short-term range is 12973.75 to 11068.50. The index is currently testing its retracement zone at 12021.00 to 12246.00.
On the upside, the major resistance is the retracement zone at 12698.00 to 13082.50. On the downside, the nearest support is a long-term 50% level at 11671.25.
Daily Swing Chart Technical Forecast
Trader reaction to the short-term 50% level at 12021.00 is likely to determine the direction of the September E-mini NASDAQ-100 Index into the close on Monday.
Bearish Scenario
A sustained move under 12021.00 will indicate the presence of sellers. If this move creates enough downside momentum then look for a possible break into the long-term 50% level at 11671.25.
Bullish Scenario
A sustained move over 12021.25 will signal the presence of buyers. If this generates enough upside momentum then look for a surge into the short-term Fibonacci level at 12246.00, followed by the intraday high at 12262.00.
For a look at all of today’s economic events, check out our economic calendar.
This article was originally posted on FX Empire
More From FXEMPIRE:
UK’s Northern Ireland trade law clears first parliamentary hurdle
Biden swipes at China with memorandum to combat illegal fishing
FTX Buyout Chatter Drives Robinhood Market (HOOD) Shares Up 14%
Market Participants Wait for Two Key Reports This Week; GDP and PCE
Amtrak train hits truck, derails in Missouri; injuries reported
