E-mini NASDAQ-100 Index (NQ) Futures Technical Analysis – Nearly Unchanged after Strong Rebound Rally
June E-mini NASDAQ-100 Index futures are trading lower late in the session on Thursday, but well off their earlier lows with Nvidia and other megacap growth stocks rebounding after recent losses. Helping to cap gains is slumping Cisco Systems, which fell following a dismal outlook for the company.
At 19:41 GMT, June E-mini NASDAQ-100 Index futures are at 11880.50, down 55.00 or -0.46%. The Invesco QQQ Trust ETF (QQQ) is trading $289.68, down $1.46 or -0.50%.
Some megacap growth stocks that have badly underperformed in recent months made gains and kept the NASDAQ in positive territory. Nvidia rose 2.9%, while Amazon and Tesla were each up around 1%.
Meanwhile, shares of Cisco dropped 14.4% after the networking gear maker lowered its 2022 revenue growth outlook, taking a hit from its Russia exit and component shortages related to COVID-19 lockdowns in China.

Daily Swing Chart Technical Analysis
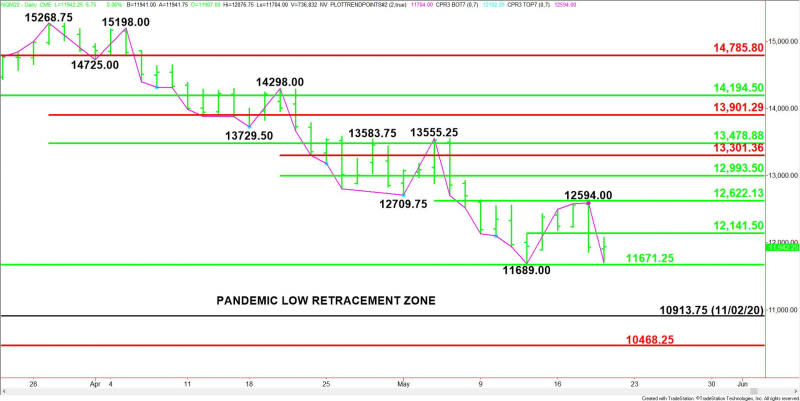
The main trend is up according to the daily swing chart. A trade through 11689.00 will signal a resumption of the downtrend. A move through 12594.00 will change the main trend to up.
The nearest support is a long-term 50% level at 11671.25.
On the upside, the nearest resistance is a 50% level at 12141.50. Another 50% level at 12622.25 is also potential resistance.
Short-Term Outlook
The direction of the June E-mini NASDAQ-100 Index into the close on Thursday and early Friday is likely to be determined by trader reaction to 11671.25.
Bearish Scenario
A sustained move under 11671.25 will indicate the presence of sellers. If this move creates enough downside momentum, we could see a near-term break into the November 2, 2020 bottom at 10913.75, followed by the long-term Fibonacci level at 10468.25.
Bullish Scenario
A sustained move over 11671.25 will signal the presence of buyers. If this generates enough upside momentum then look for a surge into 12141.50. Taking out this level will indicate the buying is getting stronger with the next major target a resistance cluster at 12594.00 to 12622.25.
For a look at all of today’s economic events, check out our economic calendar.
This article was originally posted on FX Empire

 Yahoo Finance