
 Yahoo Finance
 E-mini NASDAQ-100 Index (NQ) Futures Technical Analysis – Trading Inside Key Retracement Zone at 6794.25 to 6713.00
December E-mini NASDAQ-100 Index futures are trading lower as we approach the close. However, out of all the major indexes, this one is showing the most resiliency. The technology-based index is garnering most of its support from a strong performance in shares of Amazon. Helping to put a lid on the rally, however, is shares of Apple.
At 0206 GMT, the December E-mini NASDAQ-100 Index is trading 6761.50, down 41.75 or -0.55%.
Daily Technical Analysis
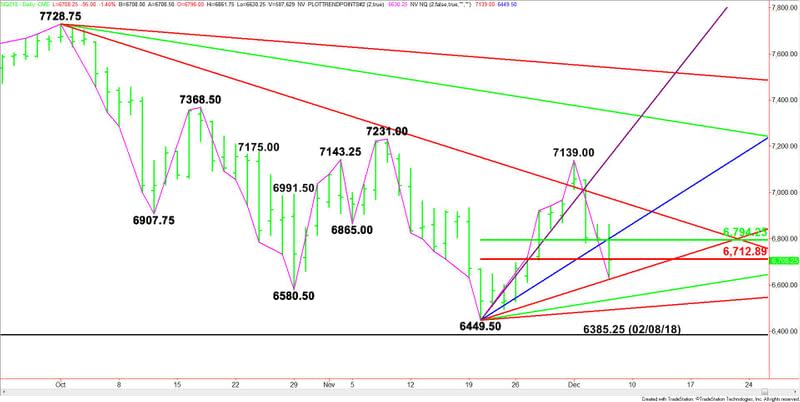
The main trend is down according to the daily swing chart. A trade through 7139.00 will change the main trend to up. A move through 6449.50 will signal a resumption of the downtrend with the next target the February 8 bottom at 6385.25.
The short-term range is 6449.50 to 7139.00. After straddling its retracement zone at 6794.25 to 6713.00 most of the session, the index is now trading to the strong side of this zone, giving it a slight upside bias into the close.
Daily Technical Forecast
Based on the current price at 6761.50, the direction of the December E-mini NASDAQ-100 Index into the close is likely to be determined by trader reaction to the uptrending Gann angle at 6801.50.
Bullish Scenario
A sustained move over 6801.50 will indicate the presence of buyers. This could generate the upside momentum needed to drive the index higher into the close with the next major target coming in at 6976.75.
Bearish Scenario
The inability to overcome 6801.50 will signal the presence of sellers. Crossing to the weak side of the 50% level at 6794.25 will indicate the selling is getting stronger. This could drive the index into the Fib level at 6713.00. If this fails then look for a retest of the intraday low at 6630.25.
This article was originally posted on FX Empire
