
 Yahoo Finance
 E-mini NASDAQ-100 Index (NQ) Futures Technical Analysis – Trend Changed to Down When 12767.25 Failed to Hold
March E-mini NASDAQ-100 Index futures are trading lower shortly before the cash market close on Friday. The weakness is being attributed to sympathy selling in reaction to the decline in the S&P 500 Index and Dow Jones Industrial Average, which fell after President-elect Joe Biden announced details of a $1.9 trillion stimulus plan and major banks released their quarterly results, kicking off the earnings reporting season.
At 20:49 GMT, March E-mini NASDAQ-100 Index futures are at 12806.00, down 95.00 or -0.74%.
The technology-driven index is down more than 1% this week, which suggests investors had been anticipating Biden’s sizeable stimulus announcement. Therefore becoming a buy the rumor, sell the fact event. Furthermore, it’s going to take weeks to get anything passed in Congress while they’re tied up with the second impeachment of President Donald Trump.
Wall Street is also worried that Biden will raise taxes to pay for his big money giveaway.
Daily Swing Chart Technical Analysis
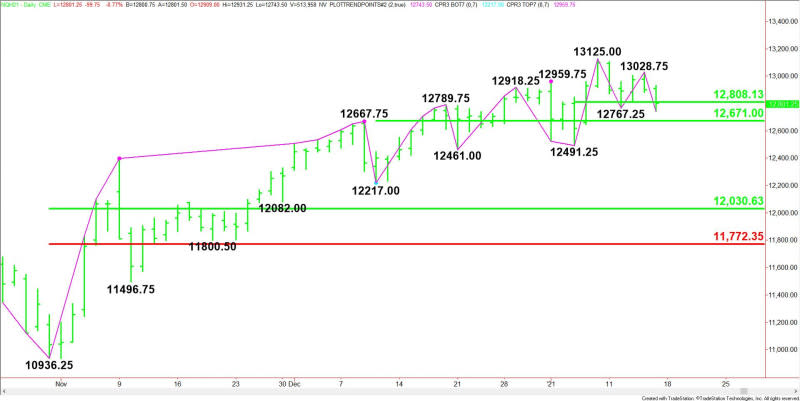
The main trend is down according to the daily swing chart. The trend turned down when sellers took out the previous main bottom at 12767.25 earlier today. A move through 13028.75 will change the main trend to up.
The minor range is 12491.25 to 13125.00. Its 50% level at 12808.25 is currently being straddled.
The short-term range is 12217.00 to 13125.00. Its 50% level at 12671.00 is the next potential downside target.
Short-Term Outlook
The direction of the March E-mini NASDAQ-100 Index futures market into the close will be determined by trader reaction to the pivot at 12808.25.
Bearish Scenario
A sustained move under 12808.25 will indicate the presence of sellers. If this move creates enough downside momentum then look for a test of the next pivot at 12671.00. This is a potential trigger point for an acceleration to the downside with 12491.25 the next target.
Bullish Scenario
A sustained move over 12808.25 will signal the presence of buyers. If this can generate enough upside momentum then look for a strong short-covering rally.
For a look at all of today’s economic events, check out our economic calendar.
This article was originally posted on FX Empire
More From FXEMPIRE:
Crude Oil Weekly Price Forecast – Crude Oil Shows Signs of Exhaustion
USD/CAD Daily Forecast – U.S. Dollar Rebounds Ahead Of The Weekend
E-mini Dow Jones Industrial Average (YM) Futures Technical Analysis – Trend Changed to Down
Ethereum, Litecoin, and Ripple’s XRP – Daily Tech Analysis – January 16th, 2021
