
 Yahoo Finance
 E-mini NASDAQ-100 Index (NQ) Futures Technical Analysis – Needs to Close Over 6822.75 to Sustain Slight Upside Bias into Friday
December E-mini NASDAQ-100 Index futures are holding on to most of its gains as we approach the close of Thursday’s session. The rally is being fueled by a rebound in shares of Apple, which are up 2 percent after briefly dipping its toe into bear market territory. The market is still down for the week, but the turnaround suggests buyers are still willing to defend the recent bottom. It also shows that investors are looking for value on dips rather than momentum and strength.
At 2047 GMT, December E-mini NASDAQ-100 Index futures are trading 6880.00, up 111.75 or +1.65%.
Daily Swing Chart Technical Analysis
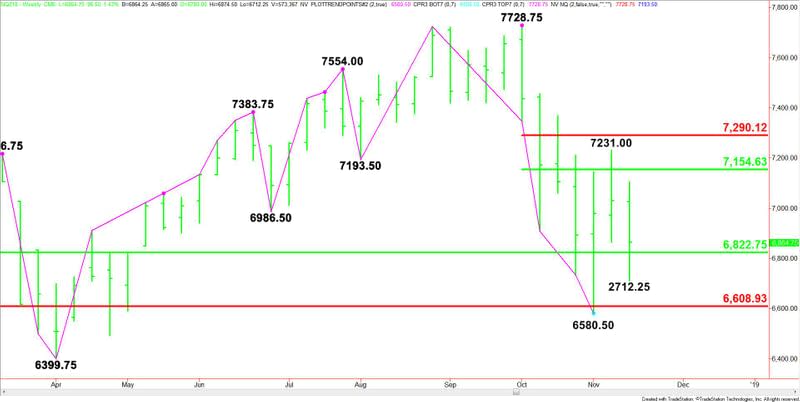
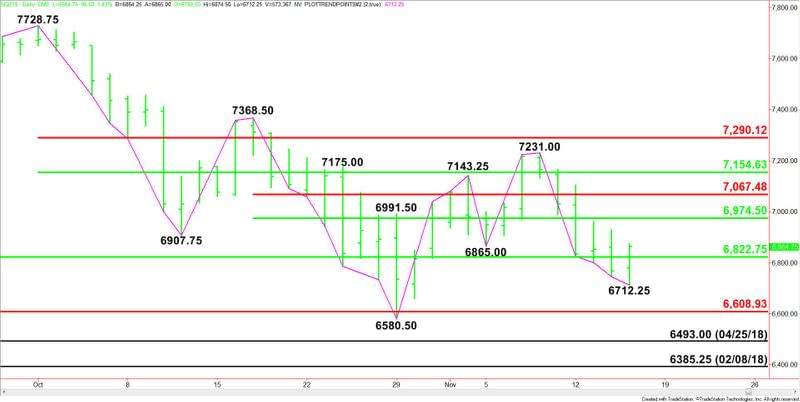
The main trend is down according to the daily swing chart. A trade through 6580.50 will reaffirm the downtrend. A move through 7231.00 will change the trend to up.
The main support is a long-term retracement zone at 6822.75 to 6580.50. This zone provided support on October 29 when the market briefly tested 6580.50 and earlier today at 6712.25. Closing on the strong side of this zone will give the index a slight upside bias ahead of Friday’s session.
The short-term retracement zone at 6974.50 to 7067.50 is the first upside target. Since the main trend is down, look for sellers on an initial test of this area.
Overcoming 7067.50 could drive the index into the next retracement zone at 7154.75 to 7290.25. This zone stopped the rally at 7231.00 on November 8.
Daily Swing Chart Technical Forecast
Based on the current price action, the direction of the December E-mini NASDAQ-100 Index into the close is likely to be determined by trader reaction to the major 50% level at 6822.75. If there is a late session surge then 6974.50 becomes the best upside target.
A break back inside the main retracement zone at 6822.75 to 6609.00 will send a mixed signal for Friday’s trade.
This article was originally posted on FX Empire
