
 Yahoo Finance
 E-mini NASDAQ-100 Index (NQ) Futures Technical Analysis – Strengthens Over 8785.50, Weakens Under 8767.25
March E-mini NASDAQ-100 Index futures closed higher on Tuesday, but posted an inside trading range that usually suggests investor indecision and impending volatility. The rally also stalled at a minor retracement zone. This zone is important because it will determine the near-term direction of the index. We’re not sure if sellers topped the intraday rally, but the light trading volume may have been a factor.
On Tuesday, March E-mini NASDAQ-100 Index futures settled at 8752.25, up 18.50 or +0.21%.
Daily Swing Chart Technical Analysis
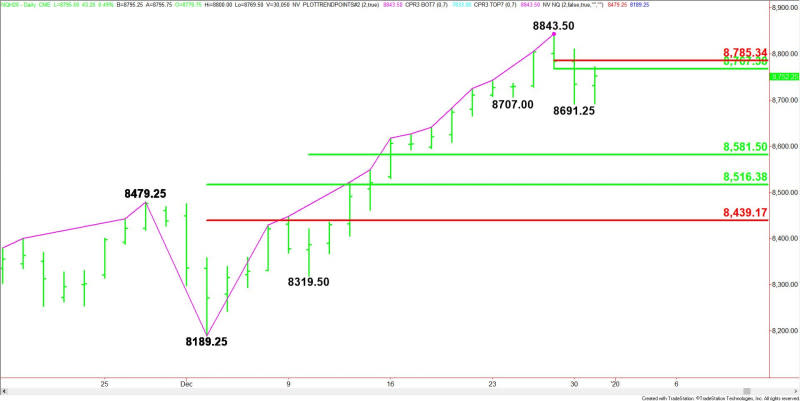
The main trend is up according to the daily swing chart, however, momentum has been trending lower since the formation of the closing price reversal top on December 27 and its subsequent confirmation on December 30.
A trade through 8843.50 will negate the closing price reversal top and signal a resumption of the uptrend. The main trend will change to down on a trade through 8189.25.
The minor trend is down. This supports the shift in momentum to the downside. A trade through 8691.25 will indicate the selling pressure is getting stronger.
The first minor range is 8843.50 to 8691.25. Its retracement zone at 8767.50 to 8785.50 is an important area. Trader reaction to this zone will determine the short-term direction of the index.
Aggressive counter-trend traders could come in on a test of 8767.50 to 8785.50. They are going to try to form a secondary lower top. This would be a potentially bearish sign.
If buyers can overcome 8785.50 then look for a potential test of the all-time high at 8843.50.
The second minor range is 8319.50 to 8843.50. Its 50% level at 8581.50 is a potential downside target.
The main range is 8189.25 to 8843.50. Its retracement zone at 8516.25 to 8439.00 is an important value zone.
Short-Term Outlook
Trader reaction to 8767.50 to 8785.50 could determine the direction of the March E-mini S&P 500 Index the rest of the week.
Look for a downside bias to develop on a sustained move under 8767.25, and for an upside bias to develop on a sustained move over 8785.50.
This article was originally posted on FX Empire
