
 Yahoo Finance
 E-mini S&P 500 Index (ES) Futures Technical Analysis – January 11, 2019 Forecast
March E-mini S&P 500 Index futures are trading lower shortly before the cash market opening. The positive vide from the conclusion of the trade talks between the United States and China may be wearing off, encouraging some bullish traders to book profits. Weaker energy prices could also be dragging down the energy sector.
At 1803 GMT, March E-mini S&P 500 Index futures are trading 2593.50, down 0.50 or -0.01%.
Daily Technical Analysis
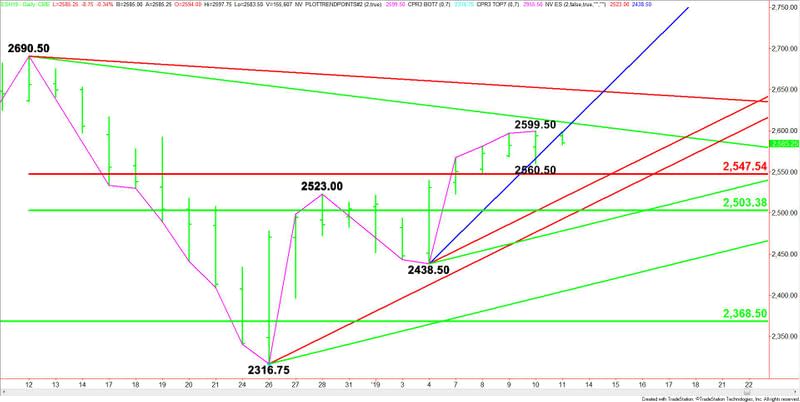
The main trend is up according to the daily swing chart. A trade through 2599.50 will signal a resumption of the uptrend. The next major target is the 2690.50 main top. A trade through 2438.50 will change the main trend to down.
The minor trend is also up. A trade through 2560.50 will change the minor trend to down. This will also shift momentum to the downside.
The main range is 2690.50 to 2316.75. Its retracement zone at 2547.50 to 2503.25 is the first downside target and support area. This zone is controlling the near-term direction of the market.
Daily Technical Forecast
Based on the earlier price action and the current price at 2586.50. The direction of the March E-mini S&P 500 Index futures contract on Friday is likely to be determined by trader reaction to the uptrending Gann angle at 2598.50.
Bullish Scenario
Overtaking and sustaining a rally over 2598.50 will indicate the return of buyers. The first target is the minor top at 2599.50. This is followed by a downtrending Gann angle at 2610.50.
The angle at 2610.50 is the trigger point for an acceleration to the upside with the next target angle coming in at 2650.50. This is the last potential resistance angle before the 2690.50 main top.
Bearish Scenario
A sustained move under 2598.50 will signal the presence of sellers. If this move creates enough downside momentum then look for a break into the minor bottom at 2560.60. Taking out this level will change the minor trend to down. This could trigger a further break into the main Fibonacci level at 2547.50.
If 2547.50 fails then look for the selling to extend into the short-term uptrending Gann angle at 2518.50.
This article was originally posted on FX Empire
